Refinery Vacuum Distillation Units (VDU) Capacity and Capital Expenditure Outlook with Details of All Operating and Planned Units, 2021-2026

Powered by

All the vital news, analysis, and commentary curated by our industry experts.

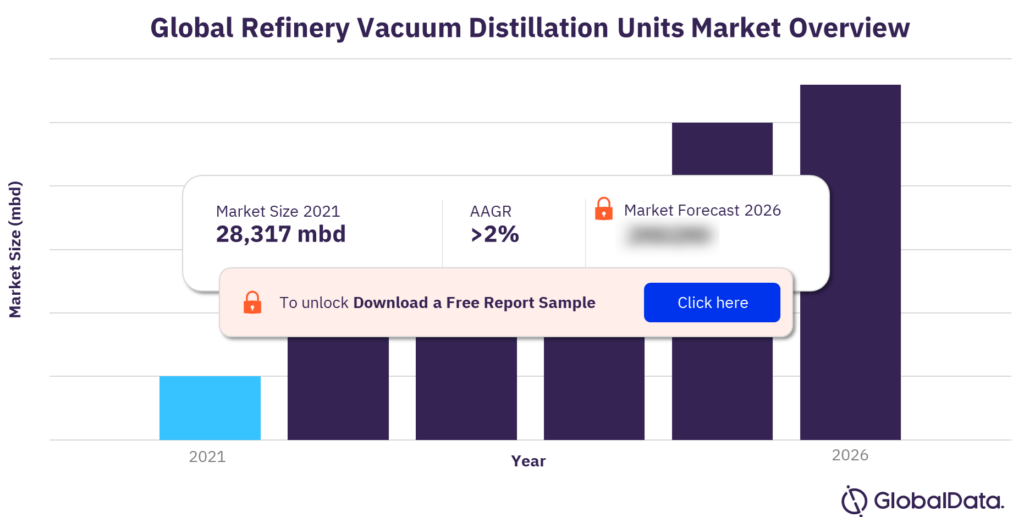
The global vacuum distillation units (VDU) capacity was valued at 28,317 mbd in 2021. The market is projected to grow at an AAGR of more than 2% during the forecast period. The US, Russia, Japan, India, and Germany are the major countries that accounted for over 45% of the total global VDU capacity in 2021.

The global refinery vacuum distillation units market research report provides details such as the refinery name, country, and refinery operator name, with in-depth coverage of vacuum distillation units capacity for all active and new-build refineries. The report also provides global and regional capital expenditure outlook by key countries, year on year, till 2026. Furthermore, it provides a comparison of key countries based on contribution to global as well as regional vacuum distillation units capacities.

Global Refinery Vacuum Distillation Units Market Outlook

Global Refinery Vacuum Distillation Units Market Outlook

To gain more insights on the global refinery vacuum distillation units market forecast, download a free report sample

What are the major planned and announced VDUs?

Some of the major planned and announced VDUs are Lagos I, Bandar Jask, Coega, Larkana, Dos Bocas, Gulei, Tianjin II, Panjin II, Shahid Ghasem Soleimani, and Khalifa.

What is the regional-level outlook in the global refinery vacuum distillation units market?

The key regions in the global refinery vacuum distillation units market are Africa, Asia, Caribbean, Central America, Europe, Former Soviet Union, Middle East, North America, Oceania, and South America.

Africa

Nigeria, South Africa, Egypt, Morocco, and Cote d’Ivoire were the key countries in Africa, accounting for most of the VDU capacity of the region in 2021. Port Harcourt I (Nigeria), Mostorod II (Egypt), Durban II (South Africa), Mohammedia (Morocco), and Mohammedia (Morocco) are the major refineries with active VDUs in the region.

Asia

Japan, India, China, South Korea, and Thailand were the key countries accounting for most of the VDU capacity of the region in 2021. Jamnagar II (India), Jamnagar I (India), Maoming (China), Vadinar (India), and Yeosu (South Korea), are the major refineries with active VDUs in the region.

Caribbean

Curacao, Aruba, Trinidad & Tobago, U.S. Virgin Islands, and Cuba were the key countries in Asia, accounting for most of the VDU capacity of the region in 2021. Curacao (Curacao), Aruba (Aruba), Pointe-a-Pierre (Trinidad and Tobago), and St. Croix (U.S. Virgin Islands) are the major refineries with active VDUs in the region.

Central America

Costa Rica is the only country in Central America, accounting for the entire capacity growth in the region. Puerto Limon (Costa Rica) is the only refinery with active VDU(s) in the region.  

Europe

Germany, Italy, the United Kingdom, Spain, and Netherlands are the key countries in Europe that accounted for over 18% of the total VDU capacity of the region in 2021. Pernis (Netherlands), Schwedt (Germany), Gelsenkirchen (Germany), Fawley (United Kingdom), and Humber (United Kingdom) are the major refineries with active VDUs in the region.

Former Soviet Union

Russia, Ukraine, Kazakhstan, Lithuania, and Belarus are the key countries in the Former Soviet Union that accounted for the majority of the VDU capacity in the region in 2021. Kremenchuk (Ukraine), Nizhny (Russia), Perm (Russia), Ryazan (Russia), and Orsk (Russia) are the major refineries with active VDUs in the region.

Middle East

Saudi Arabia, Iran, Turkey, Kuwait, and United Arab Emirates are the key countries in the Middle East that accounted for the majority of the total VDU capacity in the region in 2021. Ruwais (United Arab Emirates), Rabigh (Saudi Arabia), Mina Abdullah (Kuwait), Yanbu II (Saudi Arabia), and Izmit (Turkey), are the major refineries with active VDUs in the region.

North America

Canada and Mexico are the key countries in North America, accounting for the majority of the total VDU capacity in the region in 2021. Port Arthur II (US), Pascagoula (US), Baytown (US), Whiting (US), and Garyville (US) are the major refineries with active VDUs in the region.

Oceania

New Zealand and Australia are the key countries in Oceania. Marsden Point (New Zealand), and Geelong (Australia) are the two refineries with active VDUs in the region.

South America

Brazil, Colombia, Venezuela, Peru, and Ecuador are the key countries in South America that accounted for most of the VDU capacity of the region in 2021. Paulinia (Brazil), San Jose dos Campos (Brazil), Petrocedeno (Venezuela), Rio de Janeiro II (Brazil), and Sao Francisco do Conde (Brazil) are the major refineries with active VDUs in the region.

Global Refinery Vacuum Distillation Units Market Analysis by Regions

Global Refinery Vacuum Distillation Units Market Analysis by Regions

For more regional-level insights, download a free report sample

Market report overview

Market size (Year – 2021) 28,317 mbd
AAGR >2%
Forecast period 2021-2026
Major planned and announced VDUs Lagos I, Bandar Jask, Coega, Larkana, Dos Bocas, Gulei, Tianjin II, Panjin II, Shahid Ghasem Soleimani, and Khalifa


Key regions Africa, Asia, Caribbean, Central America, Europe, Former Soviet Union, Middle East, North America, Oceania, and South America

Scope 

  • Provides key details such as refinery name, operator name, and status for all active, suspended, planned, and announced refinery VDUs in a country.
  • Provides an annual breakdown of new-build and expansion capital expenditure outlook by region and by key countries for the period 2022–2026.

Reasons to Buy

  • Obtain the most up-to-date information available on all active, suspended, planned, and announced refinery VDUs globally
  • Identify growth segments and opportunities in the refinery VDUs industry
  • Facilitate decision-making based on strong refinery VDUs capacity data
  • Assess your competitor’s refinery VDUs portfolio

Table of Contents

| About GlobalData 2

1. Introduction 13

1.1. What is this Report About? 13

1.2. Market Definition 13

2. Global Refinery VDU, Snapshot 14

2.1. Global Refinery VDU, Key Data, 2020 14

2.2. Global Refinery VDU, Planned and Announced VDUs 16

2.3. Global Refinery VDU, New VDUs and Capacity Expansions by Region 19

2.4. Global Refinery VDU, Regional Comparisons 21

3. Africa Refinery VDU 22

3.1. Africa Refinery VDU, Snapshot 22

3.2. Africa Refinery VDU, Planned and Announced VDUs, Capacity Expansions and Capex by Country 24

3.3. Africa Refinery VDU, New VDUs and Capacity Expansions by Key Countries 28

3.4. Africa Refinery VDU, Nigeria 30

3.5. Africa Refinery VDU, South Africa 31

3.6. Africa Refinery VDU, Egypt 32

3.7. Africa Refinery VDU, Morocco 33

3.8. Africa Refinery VDU, Cote d’Ivoire 33

3.9. Africa Refinery VDU, Djibouti 34

3.10. Africa Refinery VDU, Cameroon 34

3.11. Africa Refinery VDU, Algeria 35

3.12. Africa Refinery VDU, Congo Republic 35

3.13. Africa Refinery VDU, Senegal 36

3.14. Africa Refinery VDU, Libya 36

3.15. Africa Refinery VDU, Angola 37

3.16. Africa Refinery VDU, Zambia 37

3.17. Africa Refinery VDU, South Sudan 38

3.18. Africa Refinery VDU, Ethiopia 38

3.19. Africa Refinery VDU, Ghana 39

3.20. Africa Refinery VDU, Zimbabwe 39

4. Asia Refinery VDU 40

4.1. Asia Refinery VDU, Snapshot 40

4.2. Asia Refinery VDU, Planned and Announced VDUs, Capacity Expansions and Capex by Country 42

4.3. Asia Refinery VDU, New VDUs and Capacity Expansions by Key Countries 45

4.4. Asia Refinery VDU, Japan 47

4.5. Asia Refinery VDU, India 49

4.6. Asia Refinery VDU, China 50

4.7. Asia Refinery VDU, South Korea 51

4.8. Asia Refinery VDU, Thailand 52

4.9. Asia Refinery VDU, Taiwan 53

4.10. Asia Refinery VDU, Indonesia 54

4.11. Asia Refinery VDU, Pakistan 55

4.12. Asia Refinery VDU, Singapore 56

4.13. Asia Refinery VDU, Malaysia 56

4.14. Asia Refinery VDU, Philippines 57

4.15. Asia Refinery VDU, Bangladesh 57

4.16. Asia Refinery VDU, Sri Lanka 58

4.17. Asia Refinery VDU, Mongolia 58

5. Caribbean Refinery VDU 59

5.1. Caribbean Refinery VDU, Snapshot 59

5.2. Caribbean Refinery VDU, Planned and Announced VDUs, Capacity Expansions and Capex by Country 61

5.3. Caribbean Refinery VDU, New VDUs and Capacity Expansions by Key Countries 64

5.4. Caribbean Refinery VDU, Curacao 65

5.5. Caribbean Refinery VDU, Aruba 65

5.6. Caribbean Refinery VDU, Trinidad and Tobago 66

5.7. Caribbean Refinery VDU, U.S. Virgin Islands 66

5.8. Caribbean Refinery VDU, Cuba 67

5.9. Caribbean Refinery VDU, Jamaica 67

5.10. Caribbean Refinery VDU, Bahamas 68

6. Central America Refinery VDU 69

6.1. Central America Refinery VDU, Snapshot 69

6.2. Central America Refinery VDU, Costa Rica 71

7. Europe Refinery VDU 72

7.1. Europe Refinery VDU, Snapshot 72

7.2. Europe Refinery VDU, Germany 74

7.3. Europe Refinery VDU, Italy 75

7.4. Europe Refinery VDU, United Kingdom 76

7.5. Europe Refinery VDU, Spain 77

7.6. Europe Refinery VDU, France 78

7.7. Europe Refinery VDU, Netherlands 79

7.8. Europe Refinery VDU, Belgium 80

7.9. Europe Refinery VDU, Poland 81

7.10. Europe Refinery VDU, Sweden 82

7.11. Europe Refinery VDU, Greece 83

7.12. Europe Refinery VDU, Portugal 83

7.13. Europe Refinery VDU, Finland 84

7.14. Europe Refinery VDU, Serbia 84

7.15. Europe Refinery VDU, Bulgaria 85

7.16. Europe Refinery VDU, Romania 85

7.17. Europe Refinery VDU, Hungary 86

7.18. Europe Refinery VDU, Czech Republic 86

7.19. Europe Refinery VDU, Austria 87

7.20. Europe Refinery VDU, Slovakia 87

7.21. Europe Refinery VDU, Switzerland 88

7.22. Europe Refinery VDU, Croatia 88

7.23. Europe Refinery VDU, Denmark 89

7.24. Europe Refinery VDU, Bosnia and Herzegovina 89

8. Former Soviet Union Refinery VDU 90

8.1. Former Soviet Union Refinery VDU, Snapshot 90

8.2. Former Soviet Union Refinery VDU, Planned and Announced VDUs, Capacity Expansions and Capex by Country 92

8.3. Former Soviet Union Refinery VDU, New VDUs and Capacity Expansions by Country 95

8.4. FSU Refinery VDU, Russia 96

8.5. FSU Refinery VDU, Ukraine 98

8.6. FSU Refinery VDU, Kazakhstan 98

8.7. FSU Refinery VDU, Lithuania 99

8.8. FSU Refinery VDU, Belarus 99

8.9. FSU Refinery VDU, Turkmenistan 100

8.10. FSU Refinery VDU, Uzbekistan 100

8.11. FSU Refinery VDU, Azerbaijan 101

9. Middle East Refinery VDU 102

9.1. Middle East Refinery VDU, Snapshot 102

9.2. Middle East Refinery VDU, Planned and Announced VDUs, Capacity Expansions and Capex by Country 104

9.3. Middle East Refinery VDU, New VDUs and Capacity Expansions by Country 107

9.4. Middle East Refinery VDU, Saudi Arabia 109

9.5. Middle East Refinery VDU, Iran 110

9.6. Middle East Refinery VDU, Turkey 111

9.7. Middle East Refinery VDU, Kuwait 112

9.8. Middle East Refinery VDU, United Arab Emirates 113

9.9. Middle East Refinery VDU, Israel 114

9.10. Middle East Refinery VDU, Iraq 115

9.11. Middle East Refinery VDU, Bahrain 116

9.12. Middle East Refinery VDU, Oman 116

9.13. Middle East Refinery VDU, Syria 117

9.14. Middle East Refinery VDU, Yemen 117

9.15. Middle East Refinery VDU, Jordan 118

10. North America Refinery VDU 119

10.1. North America Refinery VDU, Snapshot 119

10.2. North America Refinery VDU, Planned and Announced VDUs, Capacity Expansions and Capex by Country 121

10.3. North America Refinery VDU, New VDUs and Capacity Expansions by Country 124

10.4. Refinery VDU in the US, Gulf Coast (PADD 3) 125

10.5. Refinery VDU in the US, Midwest (PADD 2) 128

10.6. Refinery VDU in the US, West Coast (PADD 5) 130

10.7. Refinery VDU in the US, East Coast (PADD 1) 132

10.8. Refinery VDU in the US, Rocky Mountain (PADD 4) 133

10.9. Refinery VDU in Canada 134

10.10. Refinery VDU in Mexico 136

11. Oceania Refinery VDU 137

11.1. Oceania Refinery VDU, Snapshot 137

11.2. Oceania Refinery VDU, Australia 139

11.3. Oceania Refinery VDU, New Zealand 140

12. South America Refinery VDU 141

12.1. South America Refinery VDU, Snapshot 141

12.2. South America Refinery VDU, Planned and Announced VDUs, Capacity Expansions and Capex by Country 143

12.3. South America Refinery VDU, New VDUs and Capacity Expansions by Country 146

12.4. South America Refinery VDU, Brazil 147

12.5. South America Refinery VDU, Colombia 148

12.6. South America Refinery VDU, Venezuela 149

12.7. South America Refinery VDU, Peru 149

12.8. South America Refinery VDU, Ecuador 150

12.9. South America Refinery VDU, Argentina 150

12.10. South America Refinery VDU, Uruguay 151

12.11. South America Refinery VDU, Suriname 151

12.12. South America Refinery VDU, Bolivia 152

13. Appendix 153

13.1. Abbreviations 153

13.2. Status Definition 153

13.3. States by PADD Regions Included in the Report 153

13.4. Methodology 153

| Contact Us 155

Table

Table 1: Refinery VDU, Global, key statistics, 2021 14

Table 2: Refinery VDU, Global, capacity by key countries (mbd), 2016–2026 14

Table 3: Refinery VDU, Global, top 10 planned and announced VDUs details, 2022–2026 16

Table 4: Global, annual new build and expansion capital expenditure for VDUs ($M), 2022–2026 17

Table 5: Refinery VDU, Global, annual new build and expansion capital expenditure outlook for VDUs by key countries ($M), 2022–2026 18

Table 6: Refinery VDU, Global, VDU capacity additions through new and existing refinery expansions by region (mbd), 2022–2026 19

Table 7: Refinery VDU, Global, VDU capacity additions through new refineries by region (mbd), 2022–2026 19

Table 8: Refinery VDU, Global, VDU capacity additions through existing refinery expansions by region (mbd), 2022–2026 20

Table 9: Refinery VDU, regional comparison, contribution (%) to global VDUs capacity, 2016–2026 21

Table 10: Refinery VDU, Africa, key statistics, 2021 22

Table 11: Refinery VDU, Africa, capacity by key countries (mbd), 2016–2026 23

Table 12: Refinery VDU, Africa, planned and announced VDUs details, 2022–2026 24

Table 13: Refinery VDU, Africa, annual new build and expansion capital expenditure for VDUs ($M), 2022–2026 26

Table 14: Africa, annual new build and expansion capital expenditure outlook for VDUs by key countries ($M), 2022–2026 27

Table 15: Refinery VDU, Africa, VDU capacity additions through new and existing refinery expansions by key countries (mbd), 2022–2026 28

Table 16: Refinery VDU, Africa, VDU capacity additions through new refineries by key countries (mbd), 2022–2026 28

Table 17: Refinery VDU, Africa, VDU capacity additions through existing refinery expansions by country (mbd), 2022–2026 29

Table 18: Refinery VDU, Nigeria, vacuum distillation unit capacity (mbd), 2016–2026 30

Table 19: Refinery VDU, South Africa, Vacuum distillation unit capacity (mbd), 2016–2026 32

Table 20: Refinery VDU, Egypt, Vacuum distillation unit capacity (mbd), 2016–2026 33

Table 21: Refinery VDU, Morocco, Vacuum distillation unit capacity (mbd), 2016–2026 34

Table 22: Refinery VDU, Cote d’Ivoire, Vacuum distillation unit capacity (mbd), 2016–2026 34

Table 23: Refinery VDU, Djibouti, Vacuum distillation unit capacity (mbd), 2016–2026 35

Table 24: Refinery VDU, Cameroon, Vacuum distillation unit capacity (mbd), 2016–2026 35

Table 25: Refinery VDU, Algeria, Vacuum distillation unit capacity (mbd), 2016–2026 36

Table 26: Refinery VDU, Senegal, Vacuum distillation unit capacity (mbd), 2016–2026 36

Table 27: Refinery VDU, Congo Republic, Vacuum distillation unit capacity (mbd), 2016–2026 37

Table 28: Refinery VDU, Libya, Vacuum distillation unit capacity (mbd), 2016–2026 37

Table 29: Refinery VDU, Angola, Vacuum distillation unit capacity (mbd), 2016–2026 38

Table 30: Refinery VDU, Zambia, Vacuum distillation unit capacity (mbd), 2016–2026 38

Table 31: Refinery VDU, South Sudan, Vacuum distillation unit capacity (mbd), 2016–2026 39

Table 32: Refinery VDU, Sudan, Vacuum distillation unit capacity (mbd), 2016–2026 39

Table 33: Refinery VDU, Ethiopia, Vacuum distillation unit capacity (mbd), 2016–2026 39

Table 34: Refinery VDU, Zimbabwe, Vacuum distillation unit capacity (mbd), 2016–2026 40

Table 35: Refinery VDU, Ghana, Vacuum distillation unit capacity (mbd), 2016–2026 40

Table 36: Refinery VDU, Asia, key statistics, 2021 41

Table 37: Refinery VDU, Asia, capacity by key countries (mbd), 2016–2026 42

Table 38: Refinery VDU, Asia, planned and announced VDUs details, 2022–2026 43

Table 39: Refinery VDU, Asia, annual new build and expansion capital expenditure outlook for VDUs ($M), 2022–2026 44

Table 40: Asia, annual new build and expansion capital expenditure outlook for VDUs by key countries ($M), 2022–2026 45

Table 41: Refinery VDU, Asia, VDU capacity additions through new and existing refinery expansions by key countries (mbd), 2022–2026 46

Table 42: Refinery VDU, Asia, VDU capacity additions through new refineries by key countries (mbd), 2022–2026 46

Table 43: Refinery VDU, Asia, VDU capacity additions through existing refinery expansions by country (mbd), 2022–2026 47

Table 44: Refinery VDU, Japan, Vacuum distillation unit capacity (mbd), 2016–2026 48

Table 45: Refinery VDU, India, Vacuum distillation unit capacity (mbd), 2016–2026 50

Table 46: Refinery VDU, China, Vacuum distillation unit capacity (mbd), 2016–2026 51

Table 47: Refinery VDU, South Korea, Vacuum distillation unit capacity (mbd), 2016–2026 52

Table 48: Refinery VDU, Thailand, Vacuum distillation unit capacity (mbd), 2016–2026 53

Table 49: Refinery VDU, Taiwan, Vacuum distillation unit capacity (mbd), 2016–2026 54

Table 50: Refinery VDU, Indonesia, Vacuum distillation unit capacity (mbd), 2016–2026 55

Table 51: Refinery VDU, Pakistan, Vacuum distillation unit capacity (mbd), 2016–2026 56

Table 52: Refinery VDU, Singapore, Vacuum distillation unit capacity (mbd), 2016–2026 57

Table 53: Refinery VDU, Malaysia, Vacuum distillation unit capacity (mbd), 2016–2026 57

Table 54: Refinery VDU, Philippines, Vacuum distillation unit capacity (mbd), 2016–2026 58

Table 55: Refinery VDU, Sri Lanka, Vacuum distillation unit capacity (mbd), 2016–2026 58

Table 56: Refinery VDU, Bangladesh, Vacuum distillation unit capacity (mbd), 2016–2026 59

Table 57: Refinery VDU, Mongolia, Vacuum distillation unit capacity (mbd), 2016–2026 60

Table 58: Refinery VDU, Caribbean, key statistics, 2021 61

Table 59: Refinery VDU, Caribbean, capacity by key countries (mbd), 2016–2026 62

Table 60: Refinery VDU, Curacao, Vacuum distillation unit capacity (mbd), 2016–2026 63

Table 61: Refinery VDU, Aruba, Vacuum distillation unit capacity (mbd), 2016–2026 63

Table 62: Refinery VDU, Trinidad and Tobago, Vacuum distillation unit capacity (mbd), 2016–2026 64

Table 63: Refinery VDU, U.S. Virgin Islands, Vacuum distillation unit capacity (mbd), 2016–2026 64

Table 64: Refinery VDU, Cuba, Vacuum distillation unit capacity (mbd), 2016–2026 65

Table 65: Refinery VDU, Jamaica, Vacuum distillation unit capacity (mbd), 2016–2026 65

Table 66: Refinery VDU, Central America, key statistics, 2021 66

Table 67: Refinery VDU, Central America, capacity by country (mbd), 2016–2026 67

Table 68: Refinery VDU, Central America, annual new build capital expenditure outlook for VDUs ($M), 2022–2026 68

Table 69: Central America, annual new build capital expenditure outlook for VDUs by key countries ($M), 2022–2026 69

Table 70: Refinery VDU, Costa Rica, Vacuum distillation unit capacity (mbd), 2016–2026 70

Table 71: Refinery VDU, Europe, key statistics, 2021 71

Table 72: Refinery VDU, Europe, capacity by key countries (mbd), 2016–2026 72

Table 73: Refinery VDU, Germany, Vacuum distillation unit capacity (mbd), 2016–2026 73

Table 74: Refinery VDU, Italy, Vacuum distillation unit capacity (mbd), 2016–2026 74

Table 75: Refinery VDU, United Kingdom, Vacuum distillation unit capacity (mbd), 2016–2026 75

Table 76: Refinery VDU, Spain, Vacuum distillation unit capacity (mbd), 2016–2026 76

Table 77: Refinery VDU, Netherlands, Vacuum distillation unit capacity (mbd), 2016–2026 77

Table 78: Refinery VDU, France, Vacuum distillation unit capacity (mbd), 2016–2026 78

Table 79: Refinery VDU, Belgium, Vacuum distillation unit capacity (mbd), 2016–2026 79

Table 80: Refinery VDU, Poland, Vacuum distillation unit capacity (mbd), 2016–2026 80

Table 81: Refinery VDU, Sweden, Vacuum distillation unit capacity (mbd), 2016–2026 81

Table 82: Refinery VDU, Greece, Vacuum distillation unit capacity (mbd), 2016–2026 82

Table 83: Refinery VDU, Finland, Vacuum distillation unit capacity (mbd), 2016–2026 82

Table 84: Refinery VDU, Serbia, Vacuum distillation unit capacity (mbd), 2016–2026 83

Table 85: Refinery VDU, Bulgaria, Vacuum distillation unit capacity (mbd), 2016–2026 83

Table 86: Refinery VDU, Hungary, Vacuum distillation unit Capacity (mbd), 2016–2026 84

Table 87: Refinery VDU, Czech Republic, Vacuum distillation unit capacity (mbd), 2016–2026 84

Table 88: Refinery VDU, Romania, Vacuum distillation unit capacity (mbd), 2016–2026 85

Table 89: Refinery VDU, Portugal, Vacuum distillation unit capacity (mbd), 2016–2026 85

Table 90: Refinery VDU, Austria, Vacuum distillation unit capacity (mbd), 2016–2026 86

Table 91: Refinery VDU, Slovakia, Vacuum distillation unit capacity (mbd), 2016–2026 86

Table 92: Refinery VDU, Switzerland, Vacuum distillation unit capacity (mbd), 2016–2026 87

Table 93: Refinery VDU, Croatia, Vacuum distillation unit capacity (mbd), 2016–2026 87

Table 94: Refinery VDU, Denmark, Vacuum distillation unit capacity (mbd), 2016–2026 88

Table 95: Refinery VDU, Bosnia and Herzegovina, Vacuum distillation unit capacity (mbd), 2016–2026 88

Table 96: Refinery VDU, Former Soviet Union, key statistics, 2021 89

Table 97: Refinery VDU, Former Soviet Union, capacity by key countries (mbd), 2016–2026 90

Table 98: Refinery VDU, Former Soviet Union, planned and announced VDUs details, 2022–2026 91

Table 99: Refinery VDU, Former Soviet Union, annual new build capital expenditure outlook for VDUs ($M), 2022–2026 92

Table 100: Former Soviet Union, annual new build capital expenditure outlook for VDUs by country ($M), 2022–2026 93

Table 101: Refinery VDU, Former Soviet Union, VDU capacity additions through new refineries by country (mbd), 2022–2026 94

Table 102: Refinery VDU, Russia, Vacuum distillation unit capacity (mbd), 2016–2026 95

Table 103: Refinery VDU, Ukraine, Vacuum distillation unit capacity (mbd), 2016–2026 97

Table 104: Refinery VDU, Kazakhstan, Vacuum distillation unit capacity (mbd), 2016–2026 97

Table 105: Refinery VDU, Lithuania, Vacuum distillation unit capacity (mbd), 2016–2026 98

Table 106: Refinery VDU, Belarus, Vacuum distillation unit capacity (mbd), 2016–2026 98

Table 107: Refinery VDU, Turkmenistan, Vacuum distillation unit capacity (mbd), 2016–2026 99

Table 108: Refinery VDU, Uzbekistan, Vacuum distillation unit capacity (mbd), 2016–2026 99

Table 109: Refinery VDU, Azerbaijan, Vacuum distillation unit capacity (mbd), 2016–2026 100

Table 110: Refinery VDU, Georgia, Vacuum distillation unit capacity (mbd), 2016–2026 100

Table 111: Refinery VDU, Middle East, key statistics, 2021 101

Table 112: Refinery VDU, Middle East, capacity by key countries (mbd), 2016–2026 102

Table 113: Refinery VDU, Middle East, planned and announced VDUs Details, 2022–2026 103

Table 114: Refinery VDU, Middle East, annual new build and expansion capital expenditure outlook for VDUs ($M), 2022–2026 104

Table 115: Middle East, annual new build and expansion capital expenditure outlook for VDUs by country ($M), 2022–2026 105

Table 116: Refinery VDU, Middle East, VDU capacity additions through new and existing refinery expansions by country (mbd), 2022–2026 106

Table 117: Refinery VDU, Middle East, VDU capacity additions through new refineries by country (mbd), 2022–2026 106

Table 118: Refinery VDU, Middle East, VDU capacity additions through existing refinery expansions by country (mbd), 2022–2026 107

Table 119: Refinery VDU, Saudi Arabia, Vacuum distillation unit capacity (mbd), 2016–2026 108

Table 120: Refinery VDU, Iran, Vacuum distillation unit capacity (mbd), 2016–2026 109

Table 121: Refinery VDU, Turkey, Vacuum distillation unit capacity (mbd), 2016–2026 110

Table 122: Refinery VDU, Kuwait, Vacuum distillation unit capacity (mbd), 2016–2026 111

Table 123: Refinery VDU, United Arab Emirates, Vacuum distillation unit capacity (mbd), 2016–2026 112

Table 124: Refinery VDU, Israel, Vacuum distillation unit capacity (mbd), 2016–2026 113

Table 125: Refinery VDU, Iraq, Vacuum distillation unit capacity (mbd), 2016–2026 114

Table 126: Refinery VDU, Bahrain, Vacuum distillation unit capacity (mbd), 2016–2026 115

Table 127: Refinery VDU, Oman, Vacuum distillation unit capacity (mbd), 2016–2026 115

Table 128: Refinery VDU, Syria, Vacuum distillation unit capacity (mbd), 2016–2026 116

Table 129: Refinery VDU, Yemen, Vacuum distillation unit capacity (mbd), 2016–2026 116

Table 130: Refinery VDU, Jordan, Vacuum distillation unit capacity (mbd), 2016–2026 117

Table 131: Refinery VDU, North America, key statistics, 2021 118

Table 132: Refinery VDU, North America, capacity by US PADD regions, Canada and Mexico (mbd), 2016–2026 119

Table 133: Refinery VDU, North America, planned and announced VDUs details, 2022–2026 120

Table 134: Refinery VDU, North America, annual new build capital expenditure outlook for VDUs ($M), 2022–2026 121

Table 135: North America, annual new build capital expenditure outlook for VDUs by Country ($M), 2022–2026 122

Table 136: Refinery VDU, North America, VDU capacity additions through new refineries by country (mbd), 2022–2026 123

Table 137: Refinery VDU, Gulf Coast, Vacuum distillation unit capacity (mbd), 2016–2026 124

Table 138: Refinery VDU, Midwest, Vacuum distillation unit capacity (mbd), 2016–2026 127

Table 139: Refinery VDU, West Coast, Vacuum distillation unit capacity (mbd), 2016–2026 129

Table 140: Refinery VDU, East Coast, Vacuum distillation unit capacity (mbd), 2016–2026 131

Table 141: Refinery VDU, Rocky Mountain, Vacuum distillation unit capacity (mbd), 2016–2026 132

Table 142: Refinery VDU, Canada, Vacuum distillation unit capacity (mbd), 2016–2026 133

Table 143: Refinery VDU, Mexico, Vacuum distillation unit capacity (mbd), 2016–2026 135

Table 144: Refinery VDU, Oceania, key statistics, 2021 136

Table 145: Refinery VDU, Oceania, capacity by country (mbd), 2016–2026 136

Table 146: Refinery VDU, New Zealand, Vacuum distillation unit capacity (mbd), 2016–2026 138

Table 147: Refinery VDU, Australia, Vacuum distillation unit capacity (mbd), 2016–2026 139

Table 148: Refinery VDU, South America, key statistics, 2021 140

Table 149: Refinery VDU, South America, capacity by key countries (mbd), 2016–2026 141

Table 150: Refinery VDU, South America, planned and announced VDUs details, 2022–2026 142

Table 151: Refinery VDU, South America, annual new build and expansion capital expenditure outlook for VDUs ($M), 2022–2026 143

Table 152: South America, annual new build and expansion capital expenditure outlook for VDUs by country ($M), 2022–2026 144

Table 153: Refinery VDU, South America, VDU capacity additions through new and existing refinery expansions by country (mbd), 2022–2026 145

Table 154: Refinery VDU, South America, VDU capacity additions through new refineries by country (mbd), 2022–2026 145

Table 155: Refinery VDU, South America, VDU capacity additions through existing refinery expansions by country (mbd), 2022–2026 145

Table 156: Refinery VDU, Brazil, Vacuum distillation unit capacity (mbd), 2016–2026 146

Table 157: Refinery VDU, Colombia, Vacuum distillation unit capacity (mbd), 2016–2026 147

Table 158: Refinery VDU, Venezuela, Vacuum distillation unit capacity (mbd), 2016–2026 148

Table 159: Refinery VDU, Peru, Vacuum distillation unit capacity (mbd), 2016–2026 148

Table 160: Refinery VDU, Ecuador, Vacuum distillation unit capacity (mbd), 2016–2026 149

Table 161: Refinery VDU, Argentina, Vacuum distillation unit capacity (mbd), 2016–2026 149

Table 162: Refinery VDU, Uruguay, Vacuum distillation unit capacity (mbd), 2016–2026 150

Table 163: Refinery VDU, Suriname, Vacuum distillation unit capacity (mbd), 2016–2026 150

Table 164: Refinery VDU, Bolivia, Vacuum distillation unit capacity (mbd), 2016–2026 151

Figures

Figure 1: Refinery VDU, Global, capacity market share vis-à-vis growth by key countries, 2016–2021 15

Figure 2: Refinery VDU, Global, annual new build and expansion capital expenditure outlook for VDUs ($M), 2022–2026 17

Figure 3: Global, annual new build and expansion capital expenditure outlook for VDUs by key countries ($M), 2022–2026 18

Figure 4: Refinery VDU, regional comparison, contribution (%) to global VDUs capacity, 2016–2026 21

Figure 5: Refinery VDU, Africa, capacity market share vis-à-vis growth by key countries, 2016–2021 23

Figure 6: Refinery VDU, Africa, annual new build and expansion capital expenditure for VDUs ($M), 2022–2026 26

Figure 7: Africa, annual new build and expansion capital expenditure outlook for VDUs by key countries ($M), 2022–2026 27

Figure 8: Refinery VDU, Asia, capacity market share vis-à-vis growth by key countries, 2016–2021 42

Figure 9: Refinery VDU, Asia, annual new build and expansion capital expenditure outlook for VDUs ($M), 2022–2026 44

Figure 10: Asia, annual new build and expansion capital expenditure outlook for VDUs by key countries ($M), 2022–2026 45

Figure 11: Refinery VDU, Caribbean, capacity market share vis-à-vis growth by key countries, 2016–2021 62

Figure 12: Refinery VDU, Central America, capacity market share vis-à-vis growth by country, 2016–2021 67

Figure 13: Refinery VDU, Central America, annual new build capital expenditure outlook for VDUs ($M), 2022–2026 68

Figure 14: Central America, annual new build capital expenditure outlook for VDUs by key countries ($M), 2022–2026 69

Figure 15: Refinery VDU, Europe, capacity market share vis-à-vis growth by key countries, 2016–2021 72

Figure 16: Refinery VDU, Former Soviet Union, capacity market share vis-à-vis growth by key countries, 2016–2021 90

Figure 17: Refinery VDU, Former Soviet Union, annual new build capital expenditure outlook for VDUs ($M), 2022–2026* 92

Figure 18: Former Soviet Union, annual new build capital expenditure outlook for VDUs by country ($M), 2022–2026* 93

Figure 19: Refinery VDU, Middle East, capacity market share vis-à-vis growth by key countries, 2016–2021 102

Figure 20: Refinery VDU, Middle East, annual new build and expansion capital expenditure outlook for VDUs ($M), 2022–2026 104

Figure 21: Middle East, annual new build and expansion capital expenditure outlook for VDUs by country ($M), 2022–2026 105

Figure 22: Refinery VDU, North America, capacity market share vis-à-vis growth by US PADD regions, Canada and Mexico, 2016–2021 119

Figure 23: Refinery VDU, North America, annual new build capital expenditure outlook for VDUs ($M), 2022–2026 121

Figure 24: North America, annual new build capital expenditure outlook for VDUs by Country ($M), 2022–2026 122

Figure 25: Refinery VDU, Oceania, capacity market share vis-à-vis growth by country, 2016–2021 137

Figure 26: Refinery VDU, South America, capacity market share vis-à-vis growth by key countries, 2016–2021 141

Figure 27: Refinery VDU, South America, annual new build and expansion capital expenditure outlook for VDUs ($M), 2022–2026 143

Figure 28: South America, annual new build and expansion capital expenditure outlook for VDUs by Country ($M), 2022–2026 144

Frequently asked questions

Refinery Vacuum Distillation Units (VDU) Capacity and Capital Expenditure Outlook with Details of All Operating and Planned Units, 2021-2026 thematic reports
Currency USD
$5,000

Can be used by individual purchaser only

$15,000

Can be shared globally by unlimited users within the purchasing corporation e.g. all employees of a single company


Undecided about purchasing this report?

Enquire Before Buying Request a Free Sample

Get in touch to find out about multi-purchase discounts

reportstore@globaldata.com
Tel +44 20 7947 2745

Every customer’s requirement is unique. With over 220,000 construction projects tracked, we can create a tailored dataset for you based on the types of projects you are looking for. Please get in touch with your specific requirements and we can send you a quote.

Sample Report

Refinery Vacuum Distillation Units (VDU) Capacity and Capital Expenditure Outlook with Details of All Operating and Planned Units, 2021-2026 was curated by the best experts in the industry and we are confident about its unique quality. However, we want you to make the most beneficial decision for your business, so we offer free sample pages to help you:

  • Assess the relevance of the report
  • Evaluate the quality of the report
  • Justify the cost

Download your copy of the sample report and make an informed decision about whether the full report will provide you with the insights and information you need.

Below is a sample report to understand what you are buying

See what our customers are saying

“The GlobalData platform is our go-to tool for intelligence services. GlobalData provides an easy way to access comprehensive intelligence data around multiple sectors, which essentially makes it a one-for-all intelligence platform, for tendering and approaching customers.

GlobalData is very customer orientated, with a high degree of personalised services, which benefits everyday use. The highly detailed project intelligence and forecast reports can be utilised across multiple departments and workflow scopes, from operational to strategic level, and often support strategic decisions. GlobalData Analytics and visualisation solutions has contributed positively when preparing management presentations and strategic papers.”

Business Intelligence & Marketing Manager, SAL Heavy Lift

“COVID-19 has caused significant interference to our business and the COVID-19 intelligence from GlobalData has helped us reach better decisions around strategy. These two highlights have helped enormously to understand the projections into the future concerning our business units, we also utilise the project database to source new projects for Liebherr-Werk to use as an additional source to pitch for new business.”

Market Analyst & Management, Liebherr-Werk

Your daily news has saved me a lot of time and keeps me up-to-date with what is happening in the market, I like that you almost always have a link to the source origin. We also use your market data in our Strategic Business Process to support our business decisions. By having everything in one place on the Intelligence Center it has saved me a lot of time versus looking on different sources, the alert function also helps with this.

Head of Key Accounts, Saab AB

Having used several other market research companies, I find that GlobalData manages to provide that ‘difficult-to-get’ market data that others can’t, as well as very diverse and complete consumer surveys.

Marketing Intelligence Manager, Portugal Foods

Our experience with GlobalData has been very good, from the platform itself to the people. I find that the analysts and the account team have a high level of customer focus and responsiveness and therefore I can always rely on. The platform is more holistic than other providers. It is convenient and almost like a one stop shop. The pricing suite is highly competitive and value for our organisation.

I like reports that inform new segments such as the analysis on generation Z, millennials, the impact of COVID 19 to our banking customers and their new channel habits. Secondly the specialist insight on affluent sector significantly increases our understanding about this group of customers. The combination of those give us depth and breadth of the evolving market.

I’m in the business of answering and helping people make decisions so with the intelligence center I can do that, effectively and efficiently. I can share quickly key insights that answer and satisfy our country stakeholders by giving them many quality studies and primary research about competitive landscape beyond the outlook of our bank. It helps me be seen as an advisory partner and that makes a big difference. A big benefit of our subscription is that no one holds the whole data and because it allows so many people, so many different parts of our organisation have access, it enables all teams to have the same level of knowledge and decision support.

Head of Customer Insight and Research, Standard Chartered

“I know that I can always rely on Globaldata’s work when I’m searching for the right consumer and market insights. I use Globaldata insights to understand the changing market & consumer landscape and help create better taste & wellbeing solutions for our customers in food, beverage and healthcare industries.

Globaldata has the right data and the reports are of very high quality compared to your competitors. Globaldata not only has overall market sizes & consumer insights on food & beverages but also provides insights at the ingredient & flavour level. That is key for B2B companies like Givaudan. This way we understand our customers’ business and also gain insight to our unique industry”

Head of Consumer Sensory Insights, Givaudan

GlobalData provides a great range of information and reports on various sectors that is highly relevant, timely, easy to access and utilise.  The reports and data dashboards help engagement with clients; they provide valuable industry and market insights that can enrich client conversations and can help in the shaping of value propositions. Moreover, using GlobalData products has helped increase my knowledge of the finance sector, the players within it, and the general threats and opportunities.

I find the consumer surveys that are carried out to be extremely beneficial and not something I have seen anywhere else. They provided an insightful view of why and which consumers take (or don’t) particular financial products. This can help shape conversations with clients to ensure they make the right strategic decisions for their business.

One of the challenges I have found is that data in the payments space is often piecemeal. With GD all of the data I need is in one place, but it also comes with additional market reports that provide useful extra context and information. Having the ability to set-up alerts on relevant movements in the industry, be it competitors or customers, and have them emailed directly to me, ensures I get early sight of industry activity and don’t have to search for news.

Senior Account Manager, TSYS
Go even deeper with GlobalData Intelligence Center

Every Company Report we produce is powered by the GlobalData Intelligence Center.

Subscribing to our intelligence platform means you can monitor developments at Refinery Vacuum Distillation Units (VDU) Capacity and Capital Expenditure Outlook with Details of All Operating and Planned Units, 2021-2026 in real time.

  • Access a live Refinery Vacuum Distillation Units (VDU) Capacity and Capital Expenditure Outlook with Details of All Operating and Planned Units, 2021-2026 dashboard for 12 months, with up-to-the-minute insights.
  • Fuel your decision making with real-time deal coverage and media activity.
  • Turn insights on financials, deals, products and pipelines into powerful agents of commercial advantage.