Payments Industry Revenue Models in 2021 and Beyond
Powered by ![]()
All the vital news, analysis, and commentary curated by our industry experts.

Pandemic has accelerated the move away from cash towards digital payment solutions. The shift challenges traditional payment revenue models in a number of ways, including through convenient alternatives to card payments via digital wallets, payment network innovations, and simple, transparent substitutes for credit cards via buy now pay later (BNPL) apps.
This report discusses the existing revenue models in the payments market and evaluates the challenges they face from emerging technologies and business models. New solutions have the potential to allow merchants and customers to cut out a key part of the traditional payment loop, bypassing interchange fees, system fees, and service charges – with major consequences for revenues.
What is the payments revenue outlook in 2020?
The global payments revenue saw consistent growth, doubling to $2 trillion over the decade. The shift to electronic payments worldwide has enabled revenues to keep growing. The payments value chain can be grouped as digital, traditional, and disruptive. Payment revenue covered in this report is generated via a range of payment mechanisms, ranging from established digital products (such as mobile wallets), traditional methods (such as payment cards and MSCs), and disruptive forces (such as BNPL and digital currencies).
The majority of revenue is accounted for by a combination of interchange fees and MSCs from card payments in 2021. GlobalData analysis shows that the revenue will increase in 2023. By volume, mobile wallets, payment cards, and cash account for the majority of payments. By payment value, credit transfer accounts for the majority of payment value.
Most used payment methods, by volume, 2021
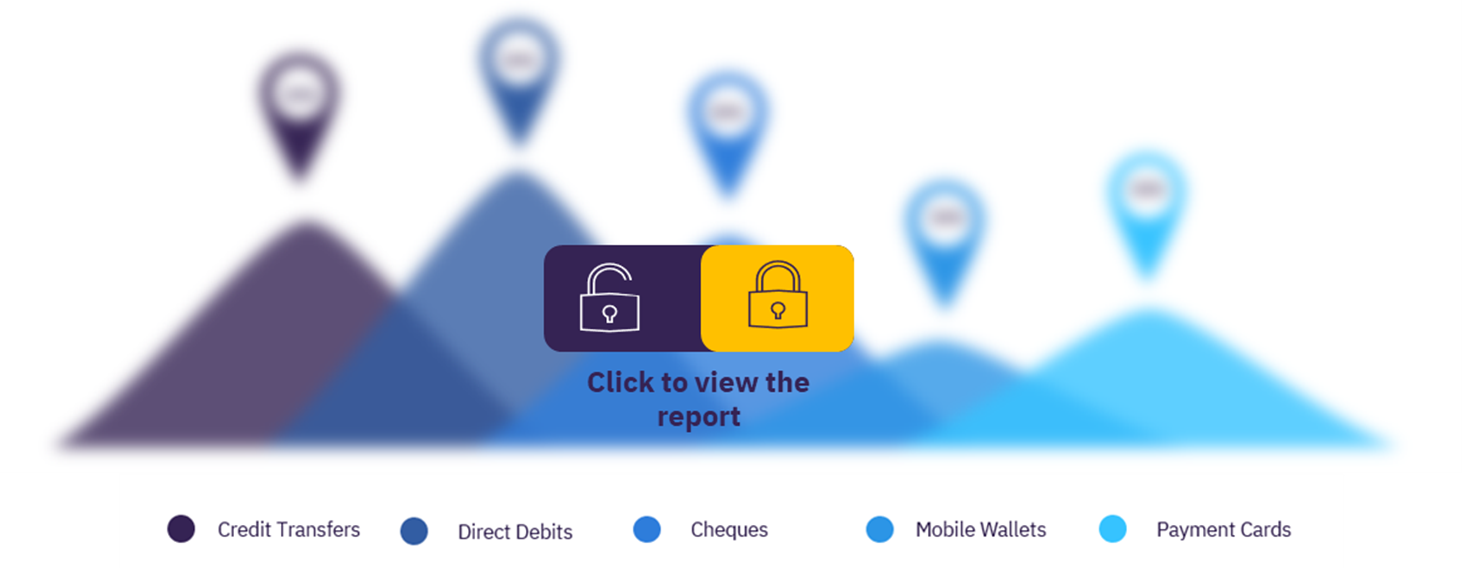
For more insights, download a free report sample
According to GlobalData’s analysis, mobile wallets are set to continue growing strongly over the next few years followed by payment cards. Cash use has contracted sharply during the pandemic, and usage will shrink by 5% between 2020 and 2023.
What factors are impacting the payment revenues?
The impact of the pandemic continues to be felt, masking other key changes to the payments industry.
Cash usage contracted: The use of cash was actively discouraged during the pandemic as it potentially enhanced the risk of viral transmission. Although not legally banned, many retailers that remained open either encouraged the use of plastic cards and contactless methods of payment or refused to accept cash. As a result, global cash transaction volume at the POS dropped 10% between 2019 and 2020.
Safer payments via digital payment model: Conversely, the pandemic accelerated the growth of the fintech sector. With lockdowns preventing bricks-and-mortar shopping for all but essential purchases, non-essential retailers adopted digital platforms to enable them to keep trading. Meanwhile, essential retailers promoted in-store contactless payments to reduce the risk of the virus as well as promoting their online channels.
Steep gains in financial app downloads: Mobile finance app downloads – which were growing steadily before the pandemic – reached more than 4.0 billion in 2020, up 15% compared to 2019. The strongest growth was seen in Latin America (over 75%), with North American downloads growing by 20% and strong double-digit growth in the Asia-Pacific and Europe.
Increase in contactless limits: Contactless limits – previously kept low in many countries due to concerns about security and fraud – increased at the onset of the pandemic and continue to do so today. In March 2020, Mastercard raised the limit in 29 countries. In April 2021, Visa reported that 1 billion additional contactless payments were made in 2020, boosted by these increased limits as well as the COVID-safe aspect.
Contactless payments limit changes (% increase) for single transaction in 2021 over 2019, by country
For more insights, download a free report sample
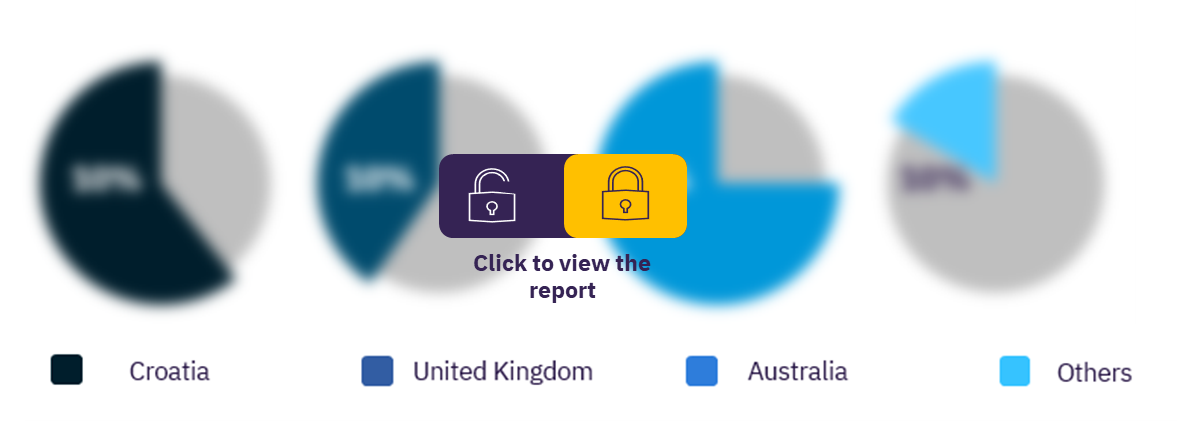
What is the regional payment landscape and how is it changing over the forecast period?
GlobalData research and analysis indicates that the changes in usage and preference for different types of payment tool brought on by the pandemic are simply accelerations of existing trends, which vary by region – often quite significantly. The payment mix varies around the world and spotlights digital growth hotspots. The analysis is based on annual payment volumes and values for all commercial and consumer transactions. The data shows payment volumes have more than doubled over the preceding 10 years while the value will grow over 150% over the same period.
By 2023 cash’s share of the payment, volume is forecast to decrease by almost 50 percentage points. Cash is expected to drop to a quarter in 2023, replaced by mobile wallets as the dominant payment mechanism. Payment cards and direct debits will remain relatively steady between 2020 and 2023, while cheques – already dwindling in usage in 2013 – will have all but disappeared by 2023.
Regional analysis reveals substantial variation in the payment mix, with mobile wallets dominating in the Asia-Pacific. Asia-Pacific is the prime driver in the global growth in mobile wallet use, accounting for over half of such payments in 2020 and set to account for nearly two-thirds by 2023. While plastic cards account for a growing share of payments in North America.
Scope
- The report estimates the current global payment revenues.
- Two key revenue streams – interchange fees and merchant service charges (MSCs), both specific to card-based transactions – account for around half of payment revenue.
- The pandemic has slashed the use of cash across many regions, although in traditionally cash-dependent areas it will continue to dominate over the short term.
- While payment cards remain the dominant payment mechanism in Europe and North America, the proportion of global transactions accounted for by mobile wallets has increased rapidly. This trend will continue out to 2023, driven by especially strong usage in Asia-Pacific and growing adoption in the developed world.
Market report scope
| Revenue generated from Payments (2020) | $2.0 trillion |
| Period | 2021 |
| Most used payments methods | Credit transfer, direct debits, cheques, mobile wallets, and payment cards. |
| Regions covered | Asia-Pacific, North America, Europe, Middle East & Africa, and Latin America. |
Reasons to Buy
- Identify payments value chain, revenue generated, and most used payment methods.
- Understand the Social, Economic, and Political Changes are Impacting Payment Revenues
- Assess changing payment landscape.
- Evaluate industry challenges from COVID-19 and competition.
Klarna
Afterpay
Affirm
Visa
Mastercard
American Express
Apple
Vyne
Plaid
TrueLayer
TIPS
MobilePay
Vipps
Amazon
Table of Contents
Table
Figures
Frequently asked questions
-
What is the revenue generated from payments in 2020?
The revenue generated from payments in 2020 was $2 trillion.
-
What are the most used payment methods?
The most used payment methods are credit transfer, direct debits, cheques, mobile wallets, and payment cards.
-
What are the key regions covered in this report?
Key regions covered in this report are Asia-Pacific, North America, Europe, Middle East & Africa, and Latin America.
Get in touch to find out about multi-purchase discounts
reportstore@globaldata.com
Tel +44 20 7947 2745
Every customer’s requirement is unique. With over 220,000 construction projects tracked, we can create a tailored dataset for you based on the types of projects you are looking for. Please get in touch with your specific requirements and we can send you a quote.
Sample Report
Payments Industry Revenue Models in 2021 and Beyond was curated by the best experts in the industry and we are confident about its unique quality. However, we want you to make the most beneficial decision for your business, so we offer free sample pages to help you:
- Assess the relevance of the report
- Evaluate the quality of the report
- Justify the cost
Download your copy of the sample report and make an informed decision about whether the full report will provide you with the insights and information you need.


Related reports
View more Financial Services reports

