Point Of Sale (PoS) Software Market Trends and Analysis by Region, Terminal Type, Enterprise Size, End-user and Segment Forecast to 2030
Powered by ![]()
Access in-depth insight and stay ahead of the market

Accessing the in-depth insight from the ‘POS Software’ report can help you with:
- Market size detailing based on terminal type, enterprise size, end-user categories, and regional movement
- Mapping the entire ecosystem of the value chain and the stages associated with it
- Detailed country-level insights with breakdown provided for key market segments
- Evaluating potential growth opportunities in product, and end-use segments supported by comprehensive qualitative commentary
- Foresee possible changing dynamics of the sector and align business strategies and capitalize on them
- Identify potential regions and countries for growth opportunities
How is our ‘POS Software’ report different from other reports in the market?
- The report presents in-depth market sizing and forecasts at a segment level for more than 28 countries, including historical and forecast analysis for the period 2019-2030 for market assessment.
- Detailed segmentation by:
-
- Terminal Type – Fixed and Mobile
- Enterprise Size – Micro (Less than 50), Small (51-250), Medium (251-1000), Large (1001-4999), and Very Large (5000+)
- End-user – Retail, Travel & Hospitality, Government, BFSI, Healthcare & Pharmaceuticals, Media & Entertainment, Transportation & Logistics, and Others
- Region – North America, Western Europe, Central & Eastern Europe, Asia-Pacific, South & Central America, and Middle East & Africa
- The report covers key market drivers and challenges impacting the POS software market.
- The report also covers macro impact assessment, mergers & acquisitions (M&A) analysis, job analytics, and Porter’s analysis.
- The competitive landscape includes POS software – vendor growth-innovation matrix and top M&A deals that will help the stakeholders in the ongoing process of identifying, researching, and evaluating competitors, to gain insights to form their business strategies.
- The report can be a valuable tool for stakeholders to improve their operations, increase customer satisfaction, and maximize profitability by analyzing the latest POS software trends, tracking market growth and demand, and evaluating the existing competition in the market.
We recommend this valuable source of information to:
- Technology Startups and Leaders
- IT Hardware and Software Companies
- POS Terminal Manufacturers
- POS Software Vendors
- Large Retail Chain
- Restaurant Owners
- Merchant Acquirers
- Payment Network Companies
- Payment Technology Providers
- Private Equity
- Venture Capitalists
- Financial Advisors
POS Software Market Overview
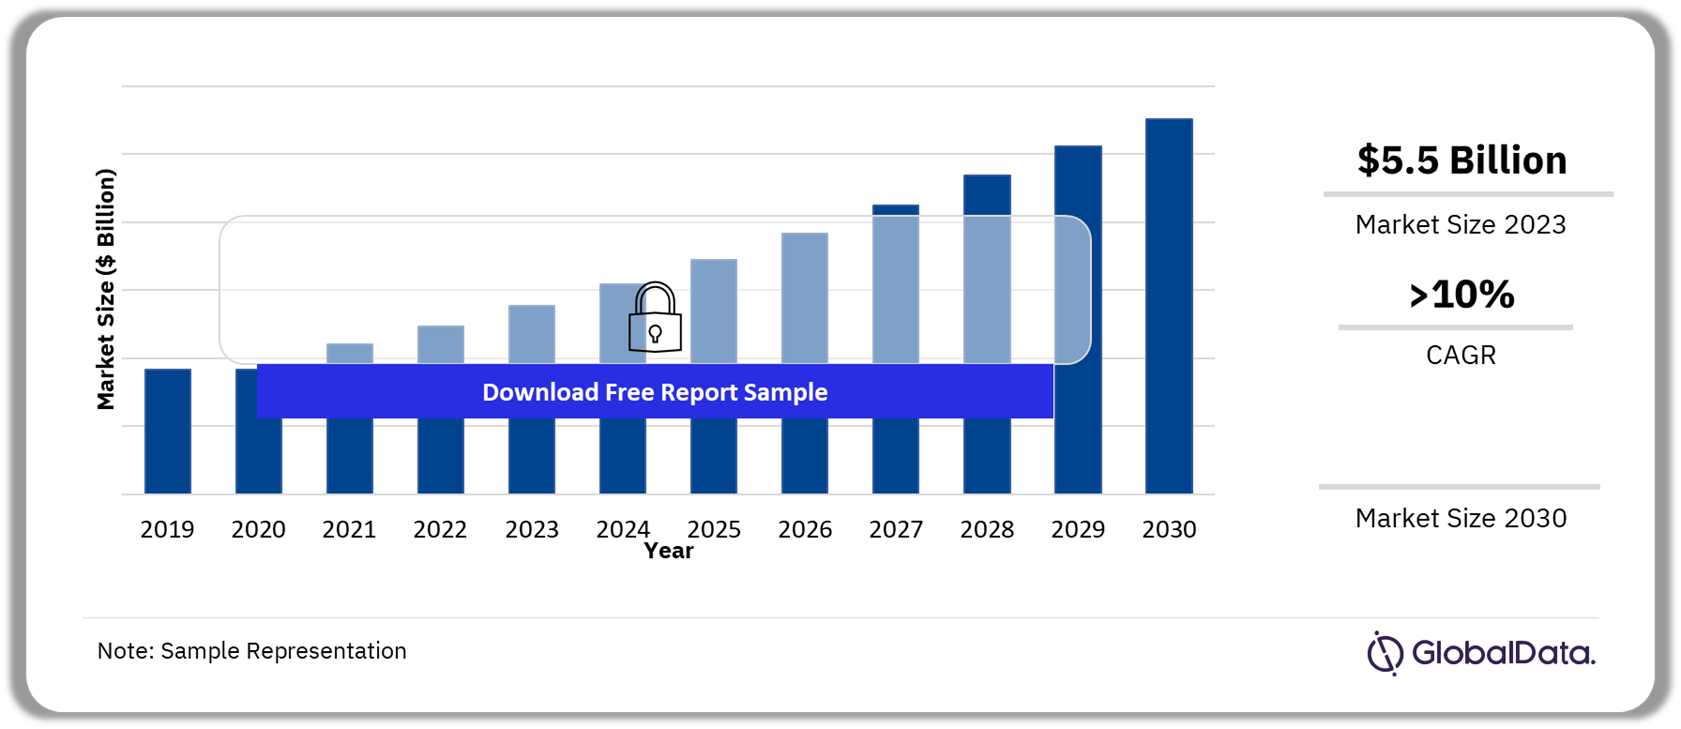
The POS software market was valued at $5.5 billion in 2023 and is expected to grow at a compound annual growth rate (CAGR) of more than 10% over the forecast period. The following are some of the key highlights of the POS software market:
- The growing adoption of cloud-based solutions and escalating demand for contactless payment methods are driving the POS software market growth.
- Furthermore, surging preference for mobile payments, and the expanding use of integrated POS software solutions are anticipated to fuel growth in the POS software market throughout the forecast period.
- Fixed POS dominated the POS software market share in 2023.
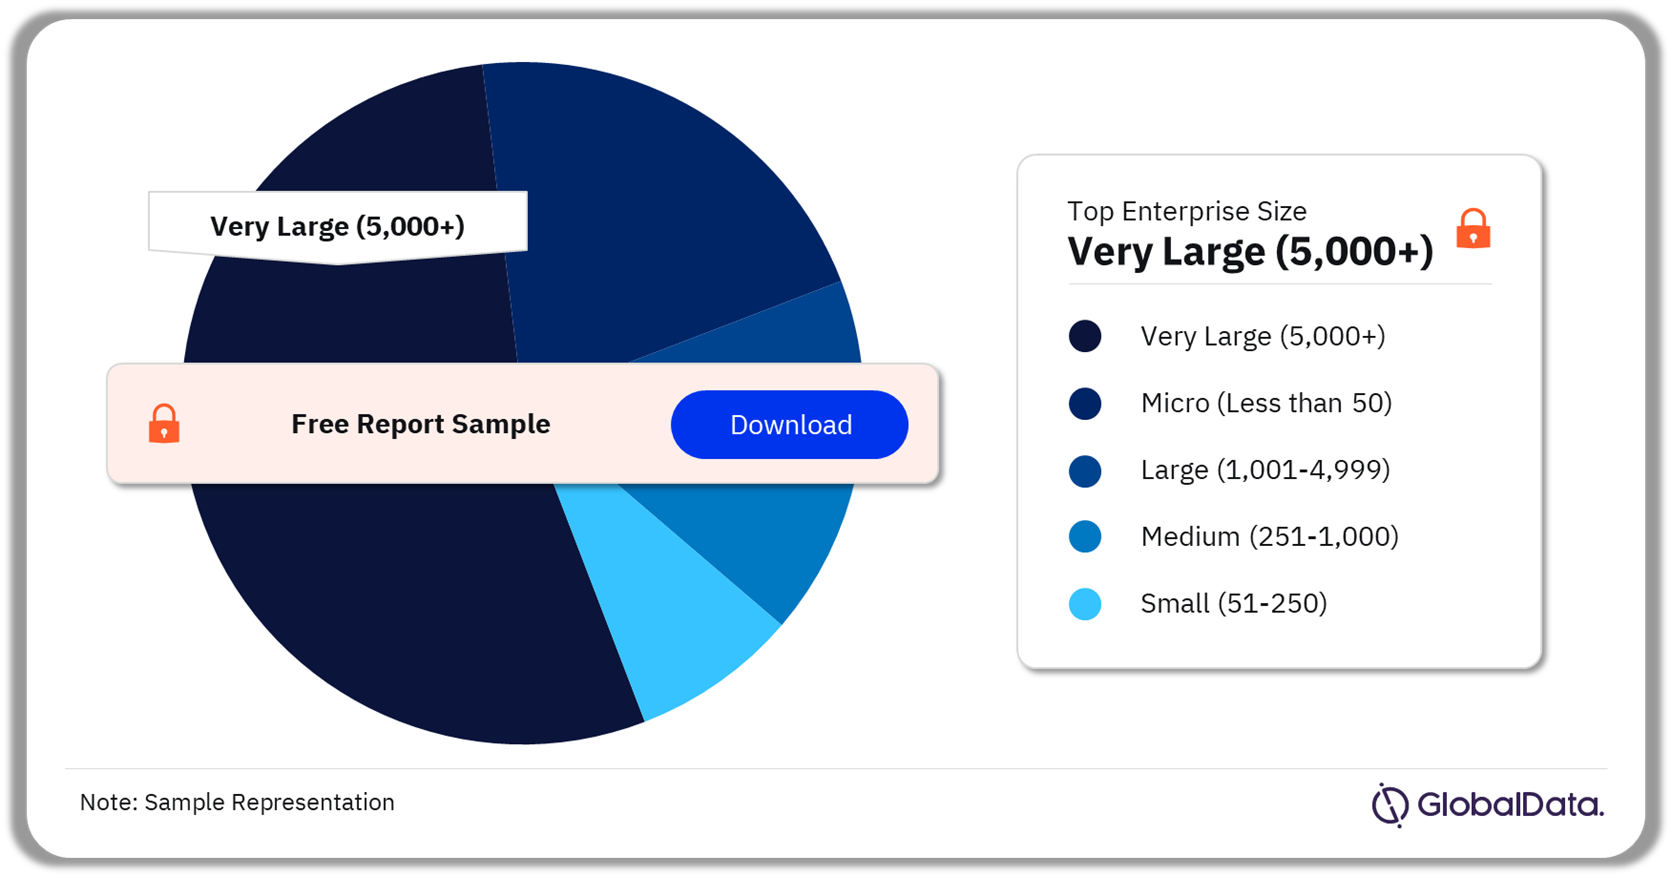
- In 2023, very large enterprises and large enterprises together accounted for over 50% of the market.
- Asia-Pacific was leading the POS software market, with a revenue share of over 30% in 2023.
POS Software Market Outlook 2019-2030 ($ Billion)
Buy the Full Report for Additional Insights on the POS Software Market Forecast
Download a Free Report Sample
Cloud technology is gaining prominence and an increasing number of businesses are embracing cloud-based POS solutions for their adaptability, affordability, and scalability. Cloud-based POS solutions offer greater flexibility as they can be accessed from any device with an internet connection. This allows business owners to manage their operations from anywhere, which is especially important for those with multiple locations or remote employees.
The adoption of integrated software solutions in POS terminals is on the rise as businesses seek to streamline their operations and improve customer experience. Integrated software solutions allow businesses to manage multiple aspects of their operations from a single point, including inventory management, customer relationship management, and financial reporting. In addition, integrated software solutions allow end users to control the business operation through a single platform, this eliminates the need for separate systems for inventory management, accounting, and customer management.
| Market Size in 2023 | $5.5 Billion |
| CAGR | >10% |
| Forecast Period | 2023 – 2030 |
| Historic Data | 2019 – 2021 |
| Report Scope & Coverage | Industry overview, revenue forecast, regional analysis, competitive landscape, company profiles, growth trends |
| Terminal Type Segment | Fixed POS and Mobile POS |
| Enterprise Size Segment | Micro (Less than 50), Small (51-250), Medium (251-1000), Large (1001-4999), and Very Large (5000+) |
| End-Use Segment | Retail, Travel & Hospitality, Government, BFSI, Healthcare & Pharmaceuticals, Media & Entertainment, Transportation & Logistics, and Others |
| Regional Segment | North America, Europe, Asia Pacific, South & Central America, Middle East & Africa |
| Key Companies | NCR Corporation, Toshiba Corporation; Oracle Corporation; Diebold Nixdorf Inc; Aptos LLC; Shopify LLC; Block Inc (formerly Square); Toast Inc; Lightspeed Commerce; and Fiserv Inc |
| Enquire & Decide | Discover the perfect solution for your business needs. Enquire now and let us help you make an informed decision before making a purchase. |
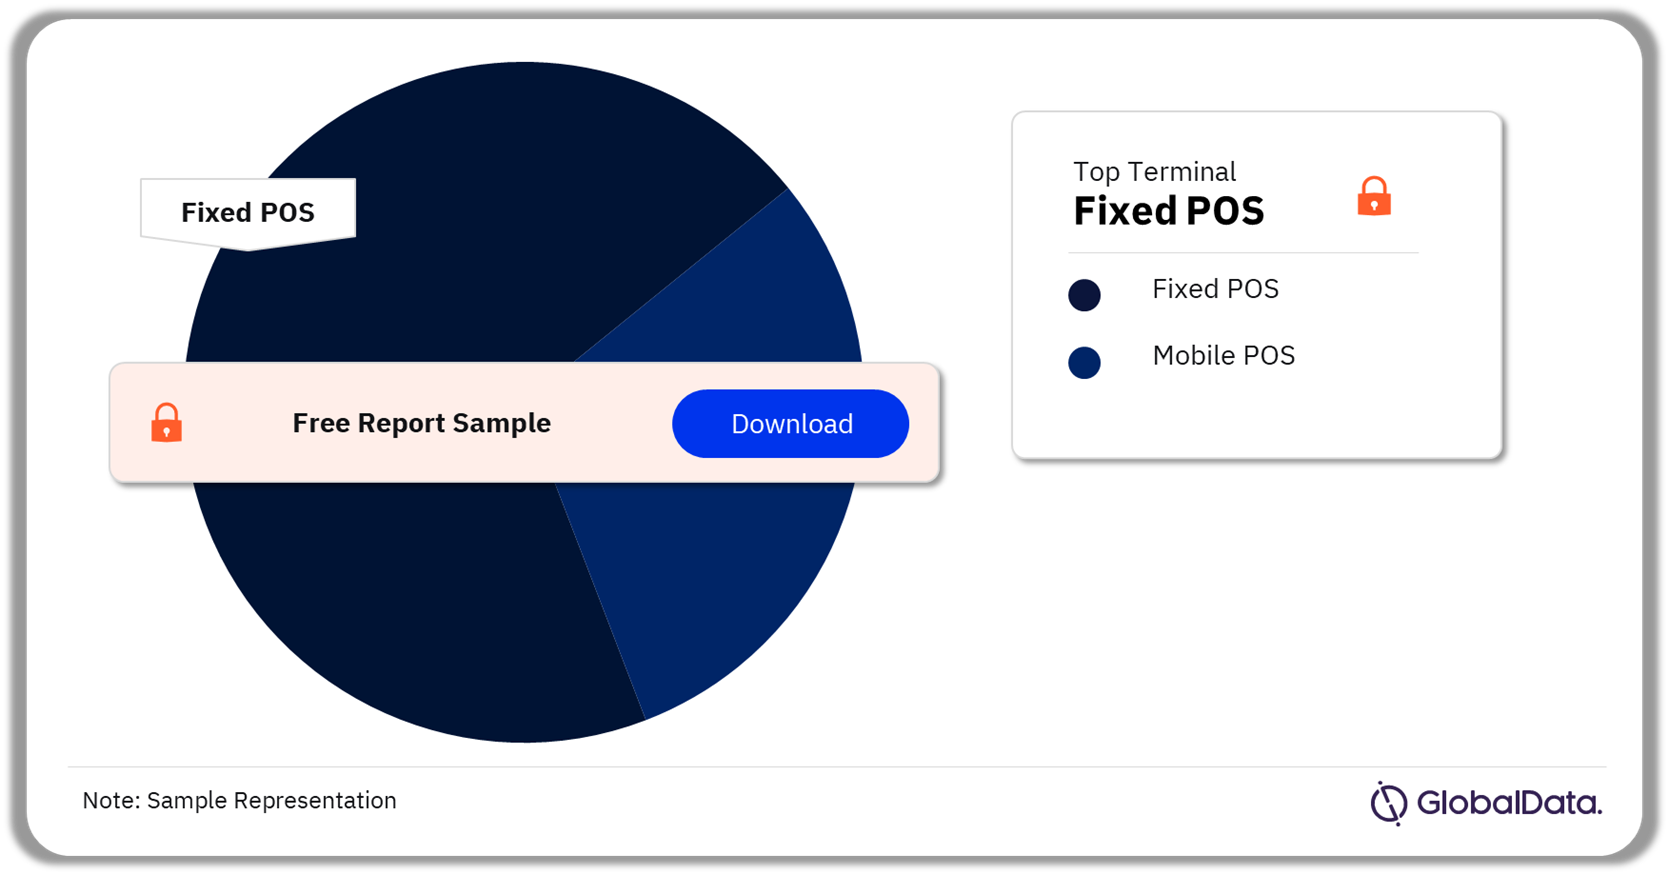
POS Software Market Segmentation by Terminal Type
The market is categorized into fixed POS and mobile POS based on terminal type. The mobile POS segment is estimated to register higher growth in the forecast period compared to fixed POS terminals. The rise in popularity of the mobile POS terminal type is driven by its convenience and flexibility, which businesses find appealing for streamlining operations and serving a mobile customer base.
POS Software Market Analysis by Terminal Type, 2023 (%)
Buy the Full Report for More Information on Terminal Types in the POS Software Market
Download a Free Report Sample
Additionally, the rise of e-commerce and mobile commerce has fueled the demand for mobile POS, enabling businesses to seamlessly integrate their online and offline sales channels. Overall, the combination of convenience, affordability, and integration capabilities is anticipated to support the growth of this segment.
POS Software Market Segmentation by Enterprise Size
The POS software market is segmented by enterprise size into micro (less than 50), small (51-250), medium (251-1000), large (1001-4999), and very large (5000+) categories. Very large enterprises and large enterprises segment is driven by the adoption of sophisticated software integrated with POS terminals. This software facilitates inventory control and customization of business processes and operations.
Medium-sized enterprises segment is forecast to record the highest CAGR during 2023-2030 among the enterprise size categories. The rapid growth can be attributed to various factors, including the increasing adoption of POS software by medium-sized enterprises to improve operational efficiency and customer experiences. The software proves beneficial for managing larger inventories and customer databases efficiently in medium-sized enterprises.
POS Software Market Analysis by Enterprise Size, 2023 (%)
Buy the Full Report for More Information on Enterprise Sizes in the POS Software Market
Download a Free Report Sample
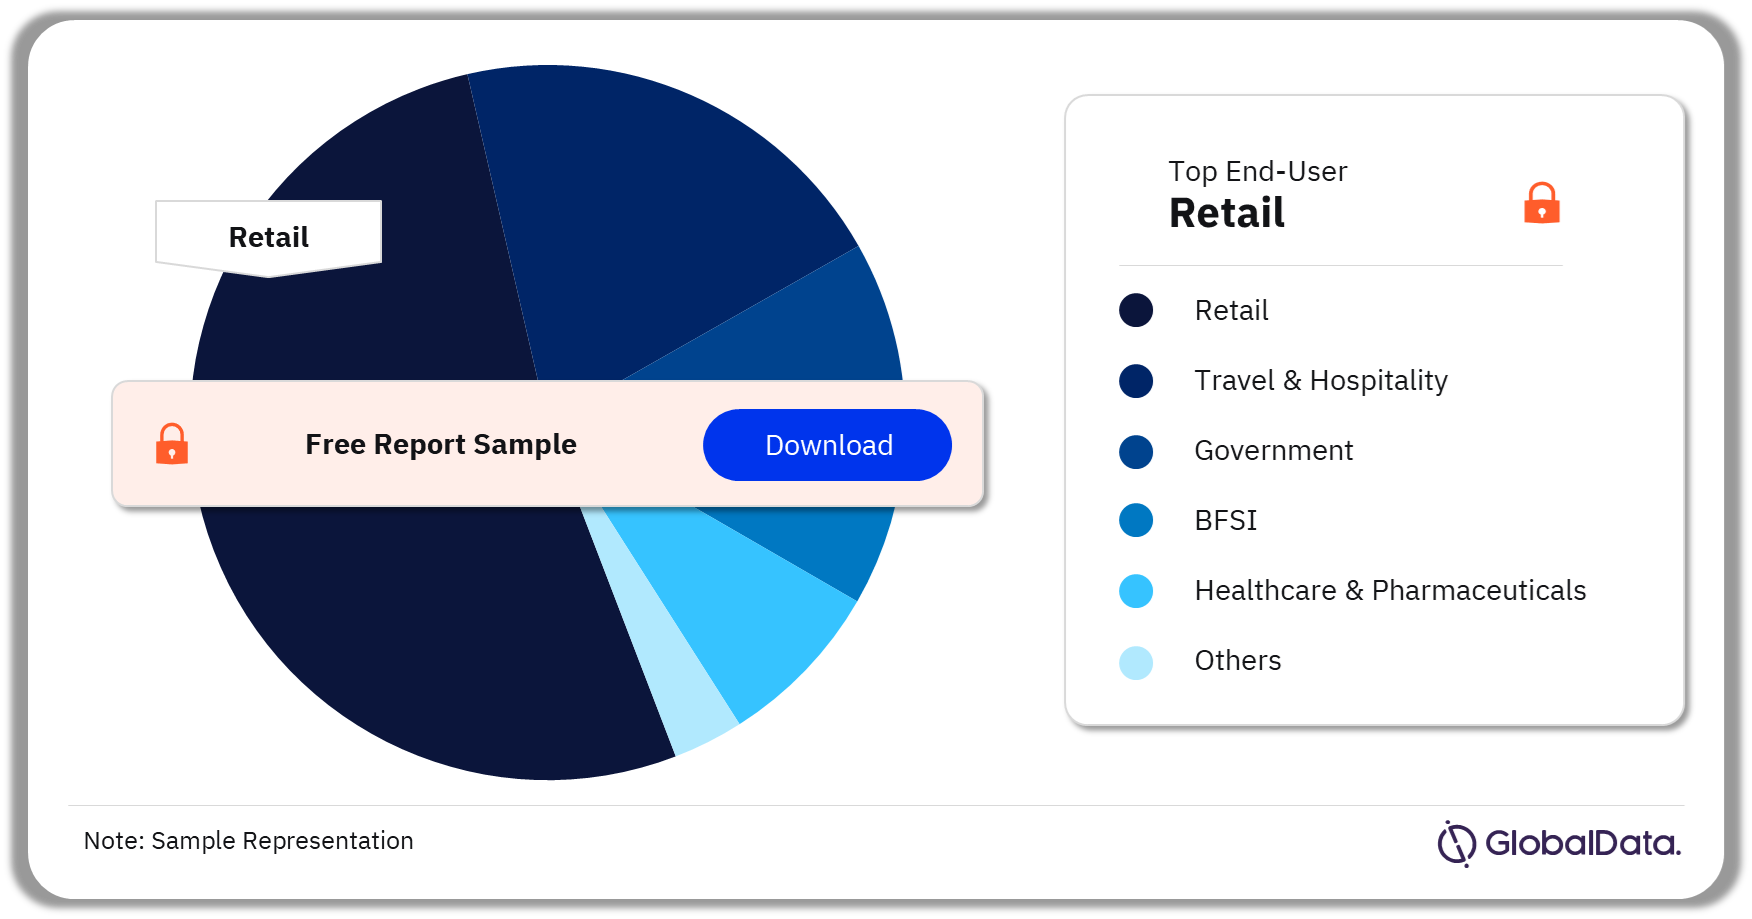
POS Software Market Segmentation by End-User
The POS software market is segmented by end-user into retail, travel & hospitality, government, BFSI, healthcare & pharmaceuticals, media & entertainment, transportation & logistics, and others. In 2023, the retail segment held the largest market share of the POS software market. The large and diverse retail industry, high demand for advanced technology solutions, need for omnichannel solutions, and cost-effectiveness of these software solutions have contributed to the retail sector’s dominance in the POS software industry.
The travel & hospitality segment is the second largest after retail and is set to grow at a CAGR of more than 10% over the forecast period. Businesses in this sector are increasingly recognizing the need for efficient management of transactions, inventory, and customer interactions.
POS Software Market Share Analysis by End-User, 2023 (%)
Buy the Full Report for More End-User Information on POS Software Market
Download a Free Report Sample
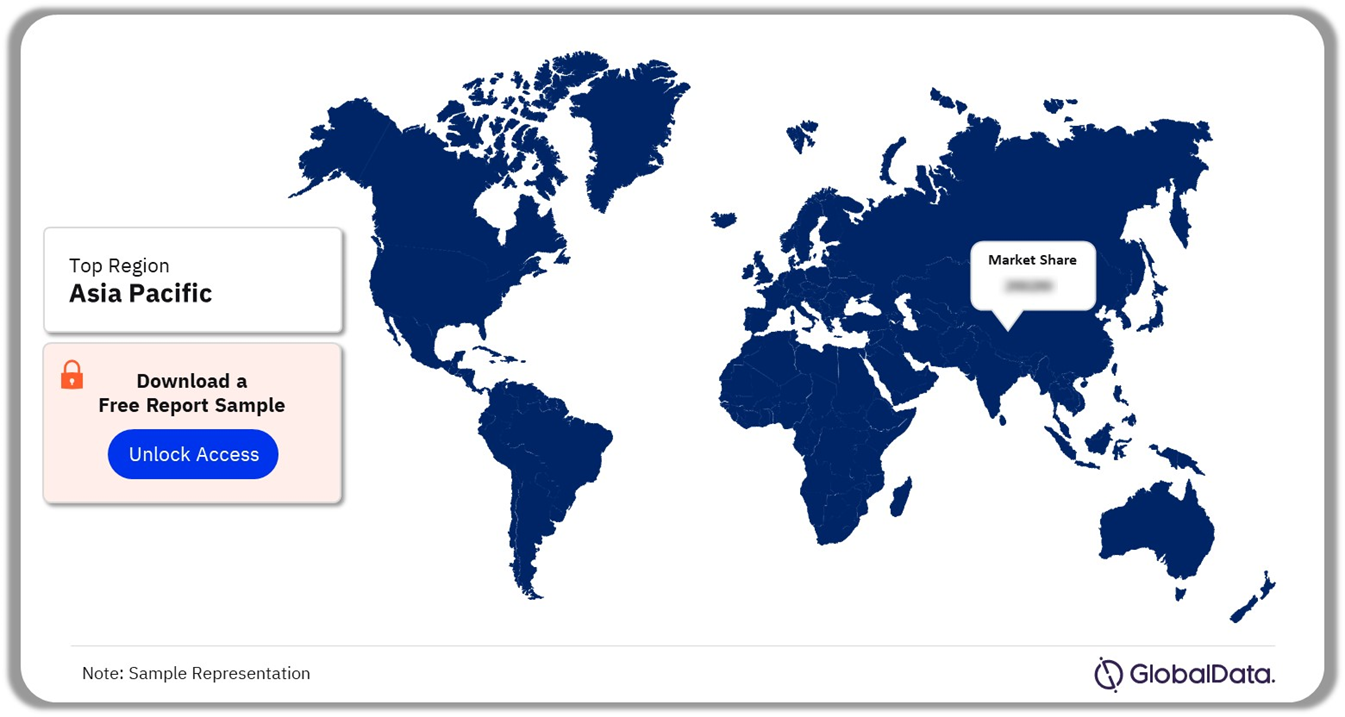
POS Software Market Analysis by Region
POS software demand in Asian-Pacific countries such as China, India, and Australia, is forecast to witness rapid growth with the regional CAGR exceeding 10% during 2023-2030. This market growth can be attributed to a surge in the adoption of cloud POS and the expanding retail industry.
In the Asia-Pacific region, the India POS software market is projected to experience the highest CAGR during the forecast period. This growth is linked to the digital transformation of India’s retail sector, driving increased adoption of POS software. The Indian government’s initiatives, including the “Digital India” campaign, have played a role in promoting the integration of POS software across various sectors. Additionally, the Government of India is contemplating a preferential market access policy to boost the manufacturing of next-gen POS terminals.
North America region held the second position in the POS software market in terms of revenue share in 2023. The region is projected to witness noticeable growth over the forecast period from 2023 to 2030. In 2023, the U.S. dominated the POS Software market in North America, accounting for over 80% of the total revenue share; and this trend is expected to continue during the predicted period.
POS Software Market Analysis by Region, 2023 (%)
Buy the Full Report for Regional Insights into the POS Software Market
Download a Free Report Sample
North America is followed by Europe, which accounts for the third-largest share in the POS Software market. Germany, the UK, France, and Italy contribute to the majority market size in Europe. The UK serves as a hub for innovation and technology adoption, with businesses in the country being recognized for their eagerness to embrace new technologies. This has led to a high level of demand for advanced POS software solutions that can meet the unique needs of UK businesses.
POS Software Market – Competitive Landscape
Numerous companies are offering a range of solutions that vary in features, and functionality, in the highly fragmented POS software industry. For organizations, this fragmentation can make it difficult to assess and compare various alternatives. This scenario is a result of the competitive nature of the market, as retailers and hospitality businesses are actively looking for POS software providers to enable them to provide consumers with a smooth experience.
There are several established players in the POS software industry, such as NCR Corporation, Toshiba Corporation, and Oracle Corporation, that have strong market positioning and brand recognition. These players often have more resources to invest in marketing, sales, and product development, which can make it difficult for newer players to gain traction. In a competitive market, vendors face significant pricing pressure. They often use dynamic pricing strategies, offering various pricing tiers to attract smaller businesses or startups and gain a competitive edge.
Leading Players in the POS Software Market
- NCR Corporation
- Toshiba Corporation
- Oracle Corporation
- Diebold Nixdorf Inc
- Aptos LLC
- Shopify LLC
- Block Inc (formerly Square)
- Toast Inc
- Lightspeed Commerce
- Fiserv Inc
Other POS Software Market Vendors Mentioned
Bold Commerce, Microsoft Corporation, Agilisys NV LLC., FIS Global, Rain Retail Software, Intuit Inc., MSI, ECR Software Corporation, Zonal, Touch Bistro, Position POS, LLC, TSG Group, Pivotal Payments, TAKU Canada Ltd, Tessitura Network, Inc, Teamwork Commerce, Rentracks Co Ltd, Evosus POS, Restaurant Manager, Vend, and Epos Now, among others.
Buy the Full Report to Know More About Leading POS Software Companies
Download a Free Report Sample
POS Software Market Segments and Scope
GlobalData Plc has segmented the POS Software market report by terminal type, enterprise size, end-user, and region:
POS Software Terminal Type Outlook (Revenue, $ Million, 2019-2030)
- Fixed POS
- Mobile POS
POS Software Enterprise Size Outlook (Revenue, $ Million, 2019-2030)
- Micro (Less than 50)
- Small (51-250)
- Medium (251-1000)
- Large (1001-4999)
- Very Large (5000+)
POS Software End User Outlook (Revenue, $ Million, 2019-2030)
- Retail
- Travel & Hospitality
- Government
- BFSI
- Healthcare & Pharmaceuticals
- Media & Entertainment
- Transportation & Logistics
- Others
POS Software Regional Outlook (Revenue, $ Million, 2019-2030)
- North America
- US
- Canada
- Europe
- Germany
- UK
- Italy
- France
- Spain
- Netherlands
- Sweden
- Rest of Europe
- Asia Pacific
- China
- Japan
- India
- Australia
- South Korea
- Rest of Asia Pacific
- South & Central America
- Brazil
- Mexico
- Argentina
- Rest of South & Central America
- Middle East & Africa
- UAE
- Saudi Arabia
- South Africa
- Rest of Middle East & Africa
Key Players
NCR CorporationToshiba Corporation
Oracle Corporation
Diebold Nixdorf Inc
Aptos LLC
Shopify LLC
Block Inc (formerly Square)
Toast Inc
Lightspeed Commerce
Fiserv Inc.
Table of Contents
Table
Figures
Frequently asked questions
-
What was the POS Software market size in 2023?
The POS software market size was valued at $5.5 billion in 2023.
-
What is the POS Software market growth rate?
The POS software market is expected to grow at a CAGR of more than 10% over the forecast period.
-
What is the key POS Software market driver?
The POS software market growth is primarily driven by the rising acceptance of contactless payment due to its convenience, speed, and safety benefits.
-
Which was the leading terminal type segment of POS software market in 2023?
Fixed terminal type was the most preferred segment of the POS software market in 2023.
-
Which was the dominating enterprise size segment of POS software market in 2023?
Very Large (5000+) enterprises dominated the POS software market in 2023.
-
Which end-user segment led the POS software market in 2023?
The retail end-user segment dominated the POS software market in 2023.
-
Which are the leading POS Software companies globally?
The key vendors in the POS software market are NCR Corporation, Toshiba Corporation; Oracle Corporation; Diebold Nixdorf Inc; Aptos LLC; Shopify LLC; Block Inc (formerly Square); Toast Inc; Lightspeed Commerce; and Fiserv Inc.
-
Is there a third level of segmentation in the report?
GlobalData’s focus is on providing reliable and accurate data that is supported by robust research methodology. Our reports undergo rigorous quality checks and are based on primary and secondary research sources, ensuring that the numbers and insights provided are trustworthy. However, despite the best efforts to gather comprehensive data, there could be instances where the available data is limited, making it challenging to provide third-level segmentation. In such cases, GlobalData may choose to provide high-level insights and general trends rather than forcing segmentation that may not be backed by sufficient data. This approach ensures that the report’s overall quality and credibility are maintained.
Get in touch to find out about multi-purchase discounts
reportstore@globaldata.com
Tel +44 20 7947 2745
Sample Report
We are confident about Point Of Sale (PoS) Software Market Trends and Analysis by Region, Terminal Type, Enterprise Size, End-user and Segment Forecast to 2030 report's unique quality. However, we want you to make the most beneficial decision for your business, so we offer free sample pages to help you:
- Assess the relevance of the report
- Evaluate the quality of the report
- Justify the cost
Download your copy of the sample report and make an informed decision about whether the full report will provide you with the insights and information you need.


Related reports
View more Point of Sale and Kiosks reports