Social Commerce Market Size, Share, Trends and Analysis by Region, Product, Access, Platform and Segment Forecast to 2030

Powered by

Access in-depth insight and stay ahead of the market

Accessing the in-depth insights from the ‘Social Commerce’ report can help:

  • Understand the current and future state of the market, allowing businesses to make informed decisions about market entry, product development, and investments.
  • Identify competitors’ capabilities to stay ahead in the market.
  • Identify segments and get an understanding of various stakeholders across different stages of the entire value chain.
  • Anticipate changes in demand and adjust the business development strategies.
  • Identify potential regions and countries for growth opportunities.

How is our ‘Social Commerce’ report different from other reports in the market?

  • The report presents in-depth market sizing and forecasts at a segment level for over 20 countries, including historical and forecast analysis for 2020-2030 for market assessment.
  • The report offers detailed segmentation by:
    • Product – Apparel, Food & Beverages, Home Products, Electronics & Accessories, Personal Care, Others
    • Access – Mobile Devices, Desktops & Laptops
    • Platform – Live Commerce, Group Buying, Super Apps, Others
    • Region – North America, Europe, Asia-Pacific, South & Central America, and Middle East & Africa
  • The report covers key market trends, drivers, and challenges impacting the social commerce market.
  • The competitive landscape includes competitive positioning of key companies and their strengths and limitations in the market that will help the stakeholders in the ongoing process of identifying, researching, and evaluating competitors, to gain insight to form their business strategies.
  • The report covers competitive profiling and benchmarking of key companies in the market to provide a deeper understanding of industry competition.
  • The report can be a valuable tool for stakeholders to improve their operations, increase customer satisfaction, and maximize profitability by analyzing the latest social commerce trends, tracking market growth and demand, and evaluating the existing competition in the market.

We recommend this valuable source of information to:

  • Social Media Companies
  • Supply Chain and Logistic Firms
  • Venture Capital Firms
  • Ecommerce Companies
  • Online Retailers
  • Investment Advisors
  • Consultancy Firms
  • Management Consultants and Analysts

Get a Snapshot of the Social Commerce Market, Download a Free Report Sample

Social Commerce Market Report Overview

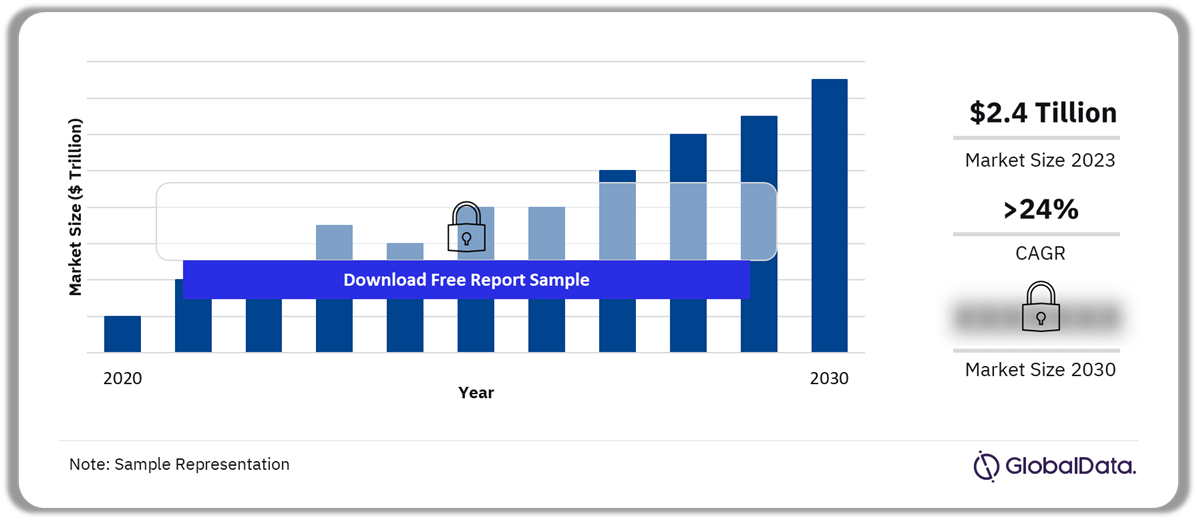
The social commerce market size was valued at $2.4 trillion in 2023 and is expected to grow at a compound annual growth rate (CAGR) of more than 24% over the forecast period. The widespread use of smartphones and increasing internet penetration have made it easier for people to connect to social media platforms at any time. This accessibility will fuel market growth, as users can browse products and make purchases directly from their social media feeds. Additionally, the integration of in-app payment features by social media platforms enables small merchants to sell their products within the app, eliminating the need for investment in their ecommerce site, and propelling market expansion.

Technologies such as the metaverse and augmented reality (AR) enable brands to craft engaging and interactive interfaces for users shopping on their platforms. Looking ahead, the metaverse and AR hold the promise of empowering brands to construct virtual environments where they can possess digital assets, establish storefronts, and sell products directly to customers. This advancement offers an immersive journey for customers, allowing them to virtually sample products before making a purchase. These capabilities are set to elevate the shopping experience, promoting growth for businesses and delighting customers.

Social Commerce Market Outlook, 2020-2030 ($Trillion)

Social Commerce Market Outlook, 2020-2030 ($Trillion)

Buy the Full Report for Additional Insights on the Social Commerce Market Forecast

Download a Free Report Sample

Social media offers small businesses the opportunity to create engaging content to connect with their customers and grow the outreach of their brands. Small businesses and brands with niche product categories are shifting to social media to attract more customers from massive online populations. Additionally, social media posts by small businesses help create brand awareness by spreading product information rapidly in a cost-efficient manner, potentially reaching millions of users, and resulting in market expansion.

In the dynamic landscape of ecommerce, there has been an increase in the popularity of apps such as Alipay, WeChat, Grab, and others that provide more than one function such as shopping and instant messaging. Termed as super apps, they have experienced a significant uptick in user adoption, driven by their intuitive interface and wide range of transactional capabilities. The built-in messaging features within these apps enable communication and sharing of information, cultivating a sense of community among users. This increases engagement and enhances the overall user experience, thereby driving growth in the social commerce market.

User-generated content (UGC) serves as a driving force for the market by fostering trust among shoppers. Authentic images shared by real customers often hold more influence than staged product photos. Shoppable user-generated content, comprising images, videos, or reviews, enables shoppers to visualize products before making online purchases. Additionally, the integration of UGC, such as comments and shares, across social commerce platforms reinforces credibility and confidence among shoppers. This authentic endorsement encourages others to make purchases with assurance, contributing to the growth of the market.

Market Size (2023) $2.4 Trillion
CAGR (2023 – 2030) >24%
Forecast Period 2023-2030
Historic Data 2020-2022
Report Scope & Coverage Revenue Forecast, Competitive Index, Company Landscape, Growth Trends
Product Apparel, Food & Beverages, Home Products, Electronics & Accessories, Personal Care, Others
Access Mobile Devices, Desktops & Laptops
Platform Live Commerce, Group Buying, Super Apps, Others
Geographies North America, Europe, Asia-Pacific, South & Central America, Middle East & Africa
Countries US, Canada, Mexico, UK, Germany, France, Netherlands, Italy, Spain, Belgium, China, India, Japan, South Korea, Australia, Singapore, Philippines, Malaysia, Indonesia, Thailand, Vietnam, Brazil, Argentina, Saudi Arabia, South Africa, UAE
Key Companies Beijing ByteDance Technology Co. Ltd., Meta Platforms Inc., PDD Holdings Inc., Pinterest Inc., Poshmark Inc., Snap Inc., Tencent Holdings Ltd., Twitter Inc., Yunji Inc.
Enquire & Decide Discover the perfect solution for your business needs. Enquire now and let us help you make an informed decision before making a purchase.

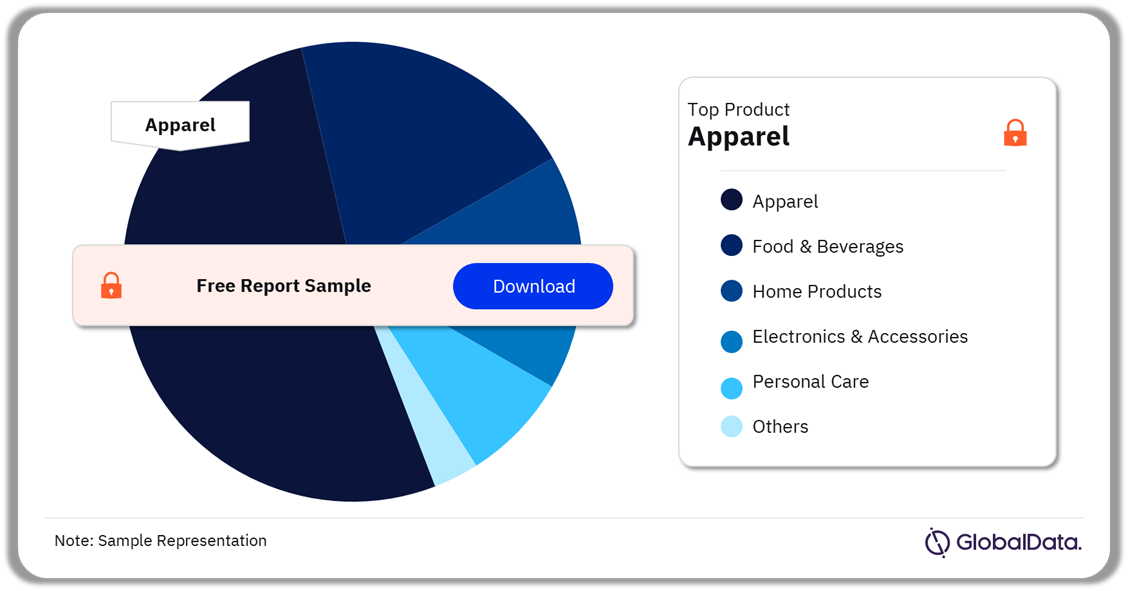
Social Commerce Market Segmentation by Product

Apparel accounted for the largest revenue share in the product segment. Social media platforms possess expansive user bases, allowing apparel brands the opportunity to reach a broader audience and capture the interest of potential customers who might not actively search for clothing on conventional e-commerce platforms. Additionally, the utilization of user-generated content and influencer partnerships on networking platforms aids in establishing trust and authenticity surrounding the brand and its offerings. Consumers tend to place greater trust in recommendations from peers or influencers they follow on social media, enhancing the brand’s credibility.

Social media platforms offer an ideal environment for users to discover new electronic products through sponsored ads, influencer endorsements, and user-generated content. Brands leverage these platforms to provide exclusive discounts and promotions, driving sales and enhancing consumer interaction. Additionally, brands can target specific demographics and personalize product suggestions based on individual preferences, making electronic products more appealing and suitable to consumers.

Social Commerce Market Share by Product, 2023 (%)

Social Commerce Market Share by Product, 2023 (%)

Buy the Full Report for More Information on Social Commerce Market Products

Download a Free Report Sample

Food and beverage items benefit from their appealing appearance on social media, attracting attention and generating interest. User-generated content, such as reviews and photos, adds credibility to these products, fostering trust and encouraging others to try them. Integrating ordering and delivery services into platforms simplifies purchasing, prompting impulse buys.

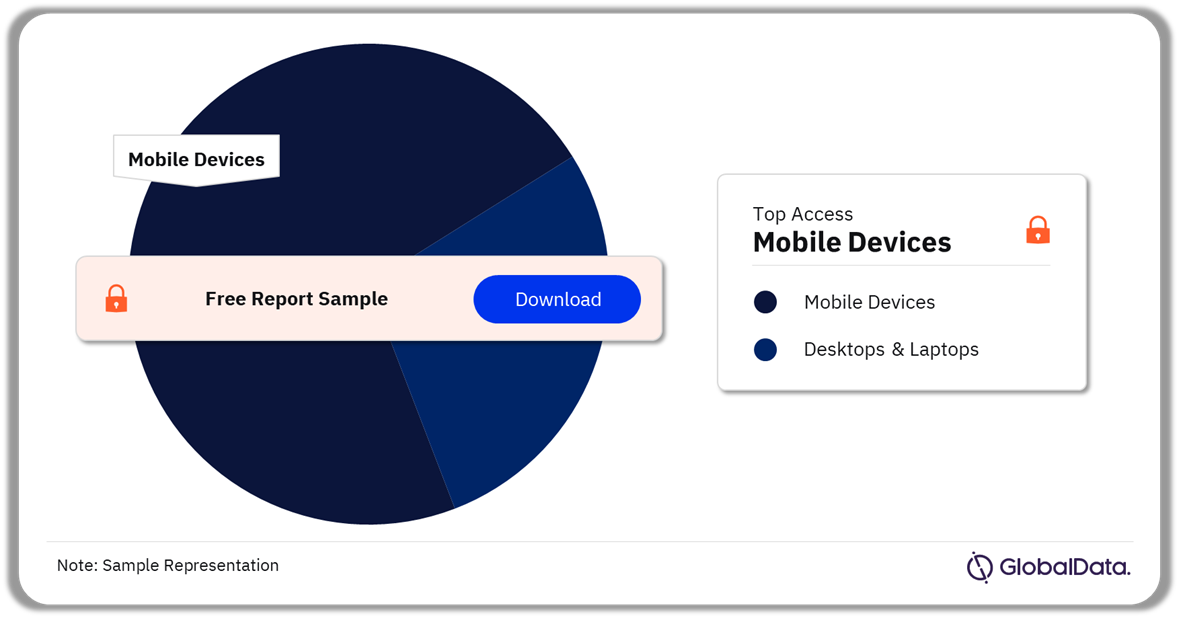
Social Commerce Market Segmentation by Access

Mobile devices are leading in the market, propelling substantial growth and influencing consumer behavior. The widespread adoption of smartphones and tablets has broadened access to networking platforms, fueling participation in online shopping. The convenience and flexibility provided by mobile devices empower consumers to explore, find, and buy products directly from their gadgets, regardless of time or location. Consequently, mobile platforms have evolved into essential components of social commerce, driving heightened user involvement, improved conversion rates, and overall enriched shopping experiences.

Social Commerce Market Share by Access, 2023 (%)

Social Commerce Market Share by Access, 2023 (%)

Buy the Full Report for More Information on Social Commerce Market Access

Download a Free Report Sample

While smartphones are popular, desktops/laptops are essential for social commerce due to their larger screens. This size advantage allows for more detailed product images, descriptions, and user reviews, creating a richer shopping experience. Desktops also enable interactive product visualization tools such as 360-degree views, enhancing product understanding. Additionally, they integrate with external software for efficient management and analysis of social commerce operations. These features of desktops/laptops are expected to drive the market in the segment.

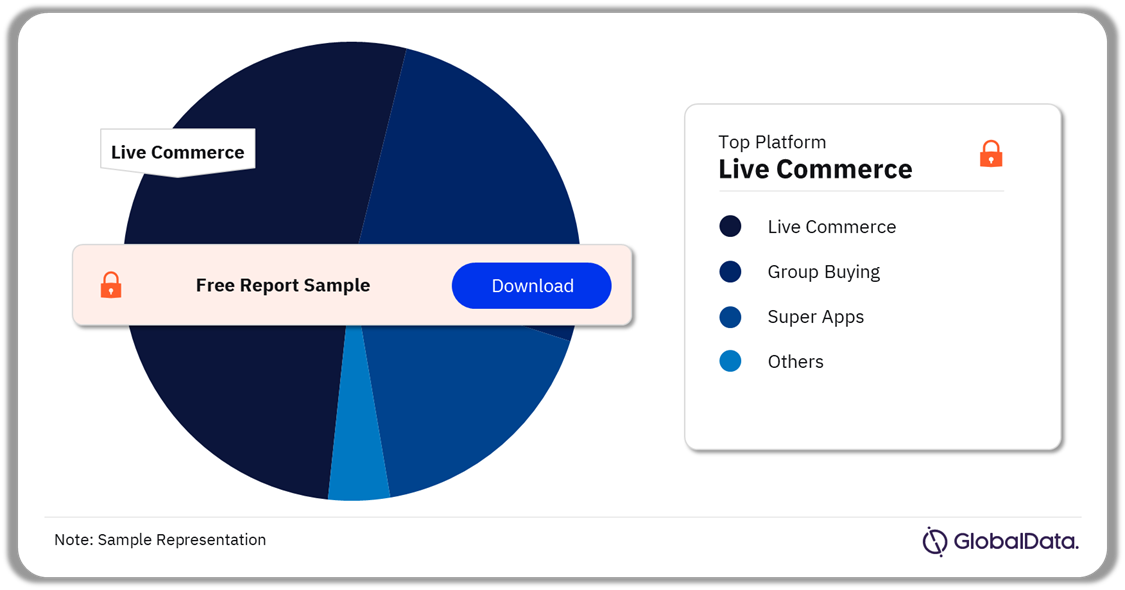
Social Commerce Market Segmentation by Platform

Live commerce emerged as the dominant platform segment in the market. It facilitates instant interaction between sellers and viewers, enabling live Q&A sessions, product demos, and feedback exchanges. Sellers showcase products in real time, offering viewers an immersive shopping experience. Live streaming often features special offers, discounts, and limited-time promotions to encourage purchases during broadcasts. Brands can partner with influencers to host live-streaming events, leveraging their reach to expand their audience and boost sales.

Super apps blend networking, messaging, e-commerce, and additional services, providing users with a holistic shopping experience. Within the app, users can browse and purchase products, simplifying the shopping journey. Moreover, super apps incorporate multiple payment options for secure transactions and offer customer support features such as chatbots or live chat for assistance with inquiries, order tracking, and troubleshooting.

Social Commerce Market Share by Platform, 2023 (%)

Social Commerce Market Share by Platform, 2023 (%)

Buy the Full Report for More Information on Social Commerce Market Platforms

Download a Free Report Sample

Group buying empowers users to utilize their combined purchasing influence on avail discounts or exclusive offers on products or services. Participants can extend invitations to friends, family, or colleagues, fostering social sharing and word-of-mouth promotions. Often, group buying presents unique deals, time-limited promotions, or bulk discounts exclusive to participants. Overall, it enriches social commerce by enabling users to save money, share enticing offers within their network, and engage in collective purchasing ventures, cultivating a community-driven and exhilarating shopping environment.

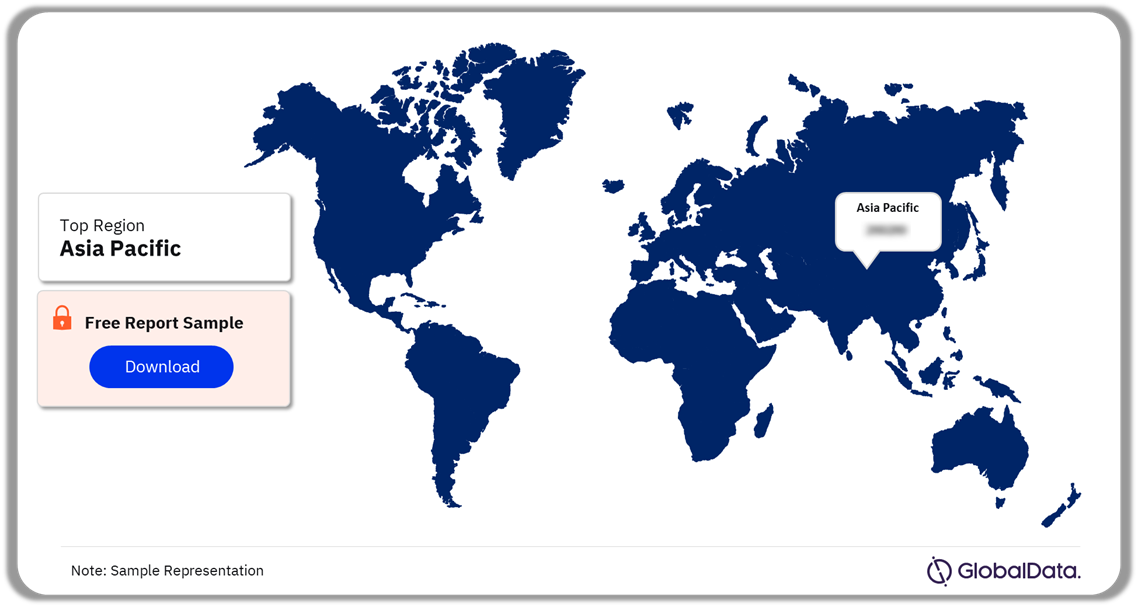
Social Commerce Market Segmentation by Region

In 2023, Asia Pacific emerged as the top revenue generator in the market. The region’s vibrant growth prospects are fueled by increased digitalization, a youthful demographic, and rising incomes. According to the mobile economy Asia Pacific 2023 report by GSMA, in 2022, the region had the highest percentage of young internet users globally, with over 1 billion smartphone users among its population. Southeast Asia drives substantial regional demand due to its renowned robust telecom infrastructure. India, witnessing rapid emergence, is a focal point for technology companies entering the social commerce landscape across the region.

The market is gaining momentum in Europe as consumers increasingly turn to platforms such as Facebook, Instagram, and TikTok for shopping. This trend is supported by the growing e-commerce penetration in the region. Major platforms are investing in enhancing their social commerce capabilities, with examples like TikTok’s beta run of TikTok Shop in select European countries. Faster checkout processes, exclusive products, and increased brand advertising on social media are driving the adoption of online shopping, particularly among younger consumers.

Social Commerce Market Share by Region, 2023 (%)

Social Commerce Market Share by Region, 2023 (%)

Buy the Full Report for Regional Insights into the Social Commerce Market

Download a Free Report Sample

High internet and smartphone penetration rates in North America make accessing social media platforms for online shopping effortless. Led by major companies such as Amazon and Walmart, the region’s strong e-commerce infrastructure simplifies the integration of social commerce features, driving adoption. North America’s tech-savvy consumers have embraced online shopping, speeding up the acceptance of social commerce. Innovative payment solutions such as digital wallets and buy now, pay later (BNPL) options are streamlining the purchasing process, making social shopping even more convenient in the region.

Social Commerce Market – Competitive Landscape

The market globally is dominated by a handful of established companies that control a significant share. The market is poised to see the entry of numerous technology startups offering diverse features on social media platforms. Additionally, social media companies are likely to encounter competition from e-commerce firms seeking to integrate social features into their existing interfaces. For instance, in May 2024, eBay introduced an interactive livestream shopping event in the UK. This approach is expected to be emulated by other e-commerce companies, intensifying competition within the market.

Key industry leaders such as Meta Platforms Inc., Beijing ByteDance Technology Ltd., and Pinterest Inc. are strategically forming partnerships and acquiring smaller companies to harness their technologies and enhance their products. For example, in January 2024, TikTok (owned by Beijing ByteDance Technology Ltd.) acquired the Indonesian e-commerce company Tokopedia. This acquisition consolidated Tokopedia and TikTok Shop Indonesia’s operations under the Tokopedia entity. By April 2024, Tokopedia had amassed over 21 million registered sellers.

Leading Companies in the Social Commerce Market

  • Beijing ByteDance Technology Co. Ltd.
  • Meta Platforms Inc.
  • PDD Holdings Inc.
  • Pinterest Inc.
  • Poshmark Inc.
  • Snap Inc.
  • Tencent Holdings Ltd.
  • Twitter Inc.
  • Yunji Inc.

Buy the Full Report to Know More About Leading Social Commerce Companies

Download a Free Report Sample

Social Commerce Market Segments

GlobalData Plc has segmented the social commerce market report by product, access, platform, and region:

Social Commerce Product Outlook (Revenue, $Billion 2020-2030)

  • Apparel
  • Food & Beverages
  • Home Products
  • Electronics & Accessories
  • Personal care
    • Others

Social Commerce Access Outlook (Revenue, $Billion 2020-2030)

  • Mobile Devices
  • Desktops & Laptops

Social Commerce Platform Outlook (Revenue, $Billion 2020-2030)

  • Live Commerce
  • Group Buying
  • Super Apps
  • Others

Social Commerce Regional Outlook (Revenue, $Billion 2020-2030)

  • North America
  • US
  • Canada
  • Mexico
  • Europe
  • UK
  • Germany
  • France
  • Netherlands
  • Italy
  • Spain
  • Belgium
  • Rest of Europe
  • Asia-Pacific
  • China
  • India
  • Japan
  • South Korea
  • Australia
  • Singapore
  • Philippines
  • Malaysia
  • Indonesia
  • Thailand
  • Vietnam
  • Rest of Asia Pacific
  • South & Central America
  • Brazil
  • Argentina
  • Rest of South & Central America
  • Middle East & Africa
  • Saudi Arabia
  • South Africa
  • UAE
  • Rest of the Middle East & Africa

Scope

  • This report provides overview and service addressable market for social commerce market.
  • It identifies the key trends impacting growth of the market over the next 12 to 24 months.
  • It includes global market forecasts for the social commerce industry and detailed competitor analysis.

Key Highlights

The global social commerce market will be valued at $ 2,398.4 billion in 2023 and is expected to grow at a compound annual growth rate (CAGR) of 24.4% over the forecast period. The rising disposable income, improved network connectivity, and proliferation of mobile devices are some of the prime factors responsible for the growth of this market.

Reasons to Buy

This market intelligence report offers a thorough, forward-looking analysis of the global social commerce market by type and key opportunities in a concise format to help executives build proactive and profitable growth strategies.

Accompanying GlobalData’s Forecast products, the report examines the assumptions, drivers, deals, strategic initiatives and trend analysis in social commerce markets.

Detailed segmentation by product – Apparel, Food & Beverages, Home Products, Electronics & Accessories, Personal Care, Others

The report also highlights key access segments Mobile Devices, Desktops & Laptops

Detailed segmentation by platform segments Live Commerce, Group Buying, Super Apps, Others

The report includes 50+ charts and tables providing in-depth analysis of the market size, forecast and supporting factors which are tailor-made for an executive-level audience, with enhanced presentation quality.

The report provides an easily digestible market assessment for decision-makers built around in-depth information gathered from local market players, which enables executives to quickly get up to speed with the current and emerging trends in social commerce markets.

The competitive section of the report helps in identifying the flagbearers, experimenters, contenders, and specialists based on their growth and innovation performance in the online retail industry which will help stakeholders analyze competition penetration.

The broad perspective of the report coupled with comprehensive, actionable detail will help mining sector stakeholders, service providers, and other social commerce players succeed in growing the social commerce market globally.

Table of Contents

  • Chapter 1 Executive Summary
  • Chapter 2 Research Scope and Segmentation
  • Chapter 3 Market Overview
  • Chapter 4 Social Commerce – Industry Trend Analysis

    • 4.1 Industry Value Chain Analysis
    • 4.2 Social Commerce – Market Drivers Analysis
    • 4.3 Social Commerce – Market Challenges Analysis
    • 4.4 Social Commerce – Market Opportunities Analysis
    • 4.5 Technology Trends
    • 4.6 Regulatory Trends

  • Chapter 5 Social Commerce Segment Outlook

    • 5.1 Social Commerce Market Revenue Snapshot
    • 5.2 Social Commerce Market by Product

      • 5.2.1 Apparel

        • 5.2.1.1 Social Commerce Market Estimates and Forecasts, by Product, Apparel, 2020-2030 ($Billion)

      • 5.2.2 Food & Beverages

        • 5.2.2.1 Social Commerce Market Estimates and Forecasts, by Product, Food & Beverages, 2020-2030 ($Billion)

      • 5.3.1 Home Products

        • 5.3.1.1 Social Commerce Market Estimates and Forecasts, by Product, Home Products, 2020-2030 ($Billion)

      • 5.3.1 Electronics & Accessories

        • 5.3.1.1 Social Commerce Market Estimates and Forecasts, by Product, Electronics & Accessories, 2020-2030 ($Billion)

      • 5.3.1 Personal Care

        • 5.3.1.1 Social Commerce Market Estimates and Forecasts, by Product, Personal Care, 2020-2030 ($Billion)

      • 5.3.1 Others

        • 5.3.1.1 Social Commerce Market Estimates and Forecasts, by Product, Others, 2020-2030 ($Billion)

    • 5.3 Social Commerce Market by Access

      • 5.3.1 Mobile Devices

        • 5.3.1.1 Social Commerce Market Estimates and Forecasts, by Product, Mobile Devices, 2020-2030 ($Billion)

      • 5.3.2 Desktops & Laptops

        • 5.3.2.1 Social Commerce Market Estimates and Forecasts, by Product, Desktops & Laptops, 2020-2030 ($Billion)

    • 5.4 Social Commerce Market by Platform

      • 5.4.1 Live Streaming

        • 5.4.1.1 Social Commerce Market Estimates and Forecasts, by Product, Live Streaming, 2020-2030 ($Billion)

      • 5.4.2 Group Buying

        • 5.4.2.1 Social Commerce Market Estimates and Forecasts, by Product, Group Buying, 2020-2030 ($Billion)

      • 5.4.1 Super Apps

        • 5.4.1.1 Social Commerce Market Estimates and Forecasts, by Product, Super Apps, 2020-2030 ($Billion)

      • 5.4.1 Others

        • 5.4.1.1 Social Commerce Market Estimates and Forecasts, by Product, Others, 2020-2030 ($Billion)

  • Chapter 6 Social Commerce Regional Outlook

    • 6.1 Social Commerce – Regional Deep Dive
    • 6.2 North America

      • 6.2.1 North America Social Commerce Market Estimates & Forecasts, 2020-2030 ($Billion)
      • 6.2.2 North America Social Commerce Market Estimates & Forecasts, by Product 2020-2030 ($Billion)
      • 6.2.3 North America Social Commerce Market Estimates & Forecasts, by Access 2020-2030 ($Billion)
      • 6.2.4 North America Social Commerce Market Estimates & Forecasts, by Platform 2020-2030 ($Billion)
      • 6.2.5 US

        • 6.2.5.1 US Social Commerce Market Estimates & Forecasts, 2020-2030 ($Billion)
        • 6.2.5.2 US Social Commerce Market Estimates & Forecasts, by Product 2020-2030 ($Billion)
        • 6.2.5.3 US Social Commerce Market Estimates & Forecasts, by Access 2020-2030 ($Billion)
        • 6.2.5.3 US Social Commerce Market Estimates & Forecasts, by Platform 2020-2030 ($Billion)

      • 6.2.6 Canada

        • 6.2.6.1 Canada Social Commerce Market Estimates & Forecasts, 2020-2030 ($Billion)
        • 6.2.6.2 Canada Social Commerce Market Estimates & Forecasts, by Product 2020-2030 ($Billion)
        • 6.2.6.3 Canada Social Commerce Market Estimates & Forecasts, by Access 2020-2030 ($Billion)
        • 6.2.6.4 Canada Social Commerce Market Estimates & Forecasts, by Platform 2020-2030 ($Billion)

      • 6.2.7 Mexico

        • 6.2.7.1 Mexico Social Commerce Market Estimates & Forecasts, 2020-2030 ($Billion)
        • 6.2.7.2 Mexico Social Commerce Market Estimates & Forecasts, by Product 2020-2030 ($Billion)
        • 6.2.7.3 Mexico Social Commerce Market Estimates & Forecasts, by Access 2020-2030 ($Billion)
        • 6.2.7.4 Mexico Social Commerce Market Estimates & Forecasts, by Platform 2020-2030 ($Billion)

    • 6.3 Europe

      • 6.3.1 Europe Social Commerce Market Estimates & Forecasts, 2020-2030 ($Billion)
      • 6.3.2 Europe Social Commerce Market Estimates & Forecasts, by Product 2020-2030 ($Billion)
      • 6.3.3 Europe Social Commerce Market Estimates & Forecasts, by Access 2020-2030 ($Billion)
      • 6.3.4 Europe Social Commerce Market Estimates & Forecasts, by Platform 2020-2030 ($Billion)
      • 6.3.5 UK

        • 6.3.5.1 UK Social Commerce Market Estimates & Forecasts, 2020-2030 ($Billion)
        • 6.3.5.2 UK Social Commerce Market Estimates & Forecasts, by Product 2020-2030 ($Billion)
        • 6.3.5.3 UK Social Commerce Market Estimates & Forecasts, by Access 2020-2030 ($Billion)
        • 6.3.5.4 UK Social Commerce Market Estimates & Forecasts, by Platform 2020-2030 ($Billion)

      • 6.3.6 Germany

        • 6.3.6.1 Germany Social Commerce Market Estimates & Forecasts, 2020-2030 ($Billion)
        • 6.3.6.2 Germany Social Commerce Market Estimates & Forecasts, by Product 2020-2030 ($Billion)
        • 6.3.6.3 Germany Social Commerce Market Estimates & Forecasts, by Access 2020-2030 ($Billion)
        • 6.3.6.4 Germany Social Commerce Market Estimates & Forecasts, by Platform 2020-2030 ($Billion)

      • 6.3.7 France

        • 6.3.7.1 France Social Commerce Market Estimates & Forecasts, 2020-2030 ($Billion)
        • 6.3.7.2 France Social Commerce Market Estimates & Forecasts, by Product 2020-2030 ($Billion)
        • 6.3.7.3 France Social Commerce Market Estimates & Forecasts, by Access 2020-2030 ($Billion)
        • 6.3.7.4 France Social Commerce Market Estimates & Forecasts, by Platform 2020-2030 ($Billion)

      • 6.3.8 Netherlands

        • 6.3.8.1 Netherlands Social Commerce Market Estimates & Forecasts, 2020-2030 ($Billion)
        • 6.3.8.2 Netherlands Social Commerce Market Estimates & Forecasts, by Product 2020-2030 ($Billion)
        • 6.3.8.3 Netherlands Social Commerce Market Estimates & Forecasts, by Access 2020-2030 ($Billion)
        • 6.3.8.4 Netherlands Social Commerce Market Estimates & Forecasts, by Platform 2020-2030 ($Billion)

      • 6.3.9 Italy

        • 6.3.9.1 Italy Social Commerce Market Estimates & Forecasts, 2020-2030 ($Billion)
        • 6.3.9.2 Italy Social Commerce Market Estimates & Forecasts, by Product 2020-2030 ($Billion)
        • 6.3.9.3 Italy Social Commerce Market Estimates & Forecasts, by Access 2020-2030 ($Billion)
        • 6.3.9.4 Italy Social Commerce Market Estimates & Forecasts, by Platform 2020-2030 ($Billion)

      • 6.3.10 Spain

        • 6.3.10.1 Spain Social Commerce Market Estimates & Forecasts, 2020-2030 ($Billion)
        • 6.3.10.2 Spain Social Commerce Market Estimates & Forecasts, by Product 2020-2030 ($Billion)
        • 6.3.10.3 Spain Social Commerce Market Estimates & Forecasts, by Access 2020-2030 ($Billion)
        • 6.3.10.4 Spain Social Commerce Market Estimates & Forecasts, by Platform 2020-2030 ($Billion)

      • 6.3.11 Belgium

        • 6.3.11.1 Belgium Social Commerce Market Estimates & Forecasts, 2020-2030 ($Billion)
        • 6.3.11.2 Belgium Social Commerce Market Estimates & Forecasts, by Product 2020-2030 ($Billion)
        • 6.3.11.3 Belgium Social Commerce Market Estimates & Forecasts, by Access 2020-2030 ($Billion)
        • 6.3.11.4 Belgium Social Commerce Market Estimates & Forecasts, by Platform 2020-2030 ($Billion)

      • 6.3.12 Rest of Europe

        • 6.3.12.1 Rest of Europe Social Commerce Market Estimates & Forecasts, 2020-2030 ($Billion)
        • 6.3.12.2 Rest of Europe Social Commerce Market Estimates & Forecasts, by Product 2020-2030 ($Billion)
        • 6.3.7.3 Rest of Europe Social Commerce Market Estimates & Forecasts, by Access 2020-2030 ($Billion)
        • 6.3.7.4 Rest of Europe Social Commerce Market Estimates & Forecasts, by Platform 2020-2030 ($Billion)

    • 6.4 Asia Pacific

      • 6.4.1 Asia Pacific Social Commerce Market Estimates & Forecasts, 2020-2030 ($Billion)
      • 6.4.2 Asia Pacific Social Commerce Market Estimates & Forecasts, by Product 2020-2030 ($Billion)
      • 6.4.3 Asia Pacific Social Commerce Market Estimates & Forecasts, by Access 2020-2030 ($Billion)
      • 6.4.4 Asia Pacific Social Commerce Market Estimates & Forecasts, by Platform 2020-2030 ($Billion)
      • 6.4.5 China

        • 6.4.5.1 China Social Commerce Market Estimates & Forecasts, 2020-2030 ($Billion)
        • 6.4.5.2 China Social Commerce Market Estimates & Forecasts, by Product 2020-2030 ($Billion)
        • 6.4.5.3 China Social Commerce Market Estimates & Forecasts, by Access 2020-2030 ($Billion)
        • 6.4.5.4 China Social Commerce Market Estimates & Forecasts, by Platform 2020-2030 ($Billion)

      • 6.4.6 India

        • 6.4.6.1 India Social Commerce Market Estimates & Forecasts, 2020-2030 ($Billion)
        • 6.4.6.2 India Social Commerce Market Estimates & Forecasts, by Product 2020-2030 ($Billion)
        • 6.4.6.3 India Social Commerce Market Estimates & Forecasts, by Access 2020-2030 ($Billion)
        • 6.4.6.4 India Social Commerce Market Estimates & Forecasts, by Platform 2020-2030 ($Billion)

      • 6.4.7 Japan

        • 6.4.7.1 Japan Social Commerce Market Estimates & Forecasts, 2020-2030 ($Billion)
        • 6.4.7.2 Japan Social Commerce Market Estimates & Forecasts, by Product 2020-2030 ($Billion)
        • 6.4.7.3 Japan Social Commerce Market Estimates & Forecasts, by Access 2020-2030 ($Billion)
        • 6.4.7.4 Japan Social Commerce Market Estimates & Forecasts, by Platform 2020-2030 ($Billion)

      • 6.4.8 South Korea

        • 6.4.8.1 South Korea Social Commerce Market Estimates & Forecasts, 2020-2030 ($Billion)
        • 6.4.8.2 South Korea Social Commerce Market Estimates & Forecasts, by Product 2020-2030 ($Billion)
        • 6.4.8.3 South Korea Social Commerce Market Estimates & Forecasts, by Access 2020-2030 ($Billion)
        • 6.4.8.4 South Korea Social Commerce Market Estimates & Forecasts, by Platform 2020-2030 ($Billion)

      • 6.4.9 Australia

        • 6.4.9.1 Australia Social Commerce Market Estimates & Forecasts, 2020-2030 ($Billion)
        • 6.4.9.2 Australia Social Commerce Market Estimates & Forecasts, by Product 2020-2030 ($Billion)
        • 6.4.9.3 Australia Social Commerce Market Estimates & Forecasts, by Access 2020-2030 ($Billion)
        • 6.4.9.4 Australia Social Commerce Market Estimates & Forecasts, by Platform 2020-2030 ($Billion)

      • 6.4.10 Singapore

        • 6.4.10.1 Singapore Social Commerce Market Estimates & Forecasts, 2020-2030 ($Billion)
        • 6.4.10.2 Singapore Social Commerce Market Estimates & Forecasts, by Product 2020-2030 ($Billion)
        • 6.4.10.3 Singapore Social Commerce Market Estimates & Forecasts, by Access 2020-2030 ($Billion)
        • 6.4.10.4 Singapore Social Commerce Market Estimates & Forecasts, by Platform 2020-2030 ($Billion)

      • 6.4.11 Philippines

        • 6.4.11.1 Philippines Social Commerce Market Estimates & Forecasts, 2020-2030 ($Billion)
        • 6.4.11.2 Philippines Social Commerce Market Estimates & Forecasts, by Product 2020-2030 ($Billion)
        • 6.4.11.3 Philippines Social Commerce Market Estimates & Forecasts, by Access 2020-2030 ($Billion)
        • 6.4.11.4 Philippines Social Commerce Market Estimates & Forecasts, by Platform 2020-2030 ($Billion)

      • 6.4.12 Malaysia

        • 6.4.12.1 Malaysia Social Commerce Market Estimates & Forecasts, 2020-2030 ($Billion)
        • 6.4.12.2 Malaysia Social Commerce Market Estimates & Forecasts, by Product 2020-2030 ($Billion)
        • 6.4.12.3 Malaysia Social Commerce Market Estimates & Forecasts, by Access 2020-2030 ($Billion)
        • 6.4.12.4 Malaysia Social Commerce Market Estimates & Forecasts, by Platform 2020-2030 ($Billion)

      • 6.4.13 Indonesia

        • 6.4.13.1 Indonesia Social Commerce Market Estimates & Forecasts, 2020-2030 ($Billion)
        • 6.4.13.2 Indonesia Social Commerce Market Estimates & Forecasts, by Product 2020-2030 ($Billion)
        • 6.4.13.3 Indonesia Social Commerce Market Estimates & Forecasts, by Access 2020-2030 ($Billion)
        • 6.4.13.4 Indonesia Social Commerce Market Estimates & Forecasts, by Platform 2020-2030 ($Billion)

      • 6.4.14 Thailand

        • 6.4.14.1 Thailand Social Commerce Market Estimates & Forecasts, 2020-2030 ($Billion)
        • 6.4.14.2 Thailand Social Commerce Market Estimates & Forecasts, by Product 2020-2030 ($Billion)
        • 6.4.14.3 Thailand Social Commerce Market Estimates & Forecasts, by Access 2020-2030 ($Billion)
        • 6.4.14.4 Thailand Social Commerce Market Estimates & Forecasts, by Platform 2020-2030 ($Billion)

      • 6.4.15 Vietnam

        • 6.4.15.1 Vietnam Social Commerce Market Estimates & Forecasts, 2020-2030 ($Billion)
        • 6.4.15.2 Vietnam Social Commerce Market Estimates & Forecasts, by Product 2020-2030 ($Billion)
        • 6.4.15.3 Vietnam Social Commerce Market Estimates & Forecasts, by Access 2020-2030 ($Billion)
        • 6.4.15.4 Vietnam Social Commerce Market Estimates & Forecasts, by Platform 2020-2030 ($Billion)

      • 6.4.16 Rest of Asia Pacific

        • 6.4.16.1 Rest of Asia Pacific Social Commerce Market Estimates & Forecasts, 2020-2030 ($Billion)
        • 6.4.16.2 Rest of Asia Pacific Social Commerce Market Estimates & Forecasts, by Product 2020-2030 ($Billion)
        • 6.4.16.3 Rest of Asia Pacific Social Commerce Market Estimates & Forecasts, by Access 2020-2030 ($Billion)
        • 6.4.16.4 Rest of Asia Pacific Social Commerce Market Estimates & Forecasts, by Platform 2020-2030 ($Billion)

    • 6.5 South & Central America

      • 6.5.1 South & Central America Social Commerce Market Estimates & Forecasts, 2020-2030 ($Billion)
      • 6.5.2 South & Central America Social Commerce Market Estimates & Forecasts, by Product 2020-2030 ($Billion)
      • 6.5.3 South & Central America Social Commerce Market Estimates & Forecasts, by Access 2020-2030 ($Billion)
      • 6.5.4 South & Central America Social Commerce Market Estimates & Forecasts, by Platform 2020-2030 ($Billion)
      • 6.5.5 Brazil

        • 6.5.5.1 Brazil Social Commerce Market Estimates & Forecasts, 2020-2030 ($Billion)
        • 6.5.5.2 Brazil Social Commerce Market Estimates & Forecasts, by Product 2020-2030 ($Billion)
        • 6.5.5.3 Brazil Social Commerce Market Estimates & Forecasts, by Access 2020-2030 ($Billion)
        • 6.5.5.4 Brazil Social Commerce Market Estimates & Forecasts, by Platform 2020-2030 ($Billion)

      • 6.5.6 Argentina

        • 6.5.6.1 Argentina Social Commerce Market Estimates & Forecasts, 2020-2030 ($Billion)
        • 6.5.6.2 Argentina Social Commerce Market Estimates & Forecasts, by Product 2020-2030 ($Billion)
        • 6.5.6.3 Argentina Social Commerce Market Estimates & Forecasts, by Access 2020-2030 ($Billion)
        • 6.5.6.4 Argentina Social Commerce Market Estimates & Forecasts, by Platform 2020-2030 ($Billion)

      • 6.5.7 Rest of South & Central America

        • 6.5.7.1 Rest of South & Central America Social Commerce Market Estimates & Forecasts, 2020-2030 ($Billion)
        • 6.5.7.2 Rest of South & Central America Social Commerce Market Estimates & Forecasts, by Product 2020-2030 ($Billion)
        • 6.5.7.3 Rest of South & Central America Social Commerce Market Estimates & Forecasts, by Access 2020-2030 ($Billion)
        • 6.5.7.4 Rest of South & Central America Social Commerce Market Estimates & Forecasts, by Platform 2020-2030 ($Billion)

    • 6.6 Middle East & Africa

      • 6.6.1 Middle East & Africa Social Commerce Market Estimates & Forecasts, 2020-2030 ($Billion)
      • 6.6.2 Middle East & Africa Social Commerce Market Estimates & Forecasts, by Product 2020-2030 ($Billion)
      • 6.6.3 Middle East & Africa Social Commerce Market Estimates & Forecasts, by Access 2020-2030 ($Billion)
      • 6.6.4 Middle East & Africa Social Commerce Market Estimates & Forecasts, by Platform 2020-2030 ($Billion)
      • 6.6.5 Saudi Arabia

        • 6.6.5.1 Saudi Arabia Social Commerce Market Estimates & Forecasts, 2020-2030 ($Billion)
        • 6.6.5.2 Saudi Arabia Social Commerce Market Estimates & Forecasts, by Product 2020-2030 ($Billion)
        • 6.6.5.3 Saudi Arabia Social Commerce Market Estimates & Forecasts, by Access 2020-2030 ($Billion)
        • 6.6.5.4 Saudi Arabia Social Commerce Market Estimates & Forecasts, by Platform 2020-2030 ($Billion)

      • 6.6.6 South Africa

        • 6.6.6.1 South Africa Social Commerce Market Estimates & Forecasts, 2020-2030 ($Billion)
        • 6.6.6.2 South Africa Social Commerce Market Estimates & Forecasts, by Product 2020-2030 ($Billion)
        • 6.6.6.3 South Africa Social Commerce Market Estimates & Forecasts, by Access 2020-2030 ($Billion)
        • 6.6.6.4 South Africa Social Commerce Market Estimates & Forecasts, by Platform 2020-2030 ($Billion)

      • 6.6.7 UAE

        • 6.6.7.1 UAE Social Commerce Market Estimates & Forecasts, 2020-2030 ($Billion)
        • 6.6.7.2 UAE Social Commerce Market Estimates & Forecasts, by Product 2020-2030 ($Billion)
        • 6.6.7.3 UAE Social Commerce Market Estimates & Forecasts, by Access 2020-2030 ($Billion)
        • 6.6.7.4 UAE Social Commerce Market Estimates & Forecasts, by Platform 2020-2030 ($Billion)

      • 6.6.8 Rest of Middle East & Africa

        • 6.6.8.1 Rest of Middle East & Africa Social Commerce Market Estimates & Forecasts, 2020-2030 ($Billion)
        • 6.6.8.2 Rest of Middle East & Africa Social Commerce Market Estimates & Forecasts, by Product 2020-2030 ($Billion)
        • 6.6.8.3 Rest of Middle East & Africa Social Commerce Market Estimates & Forecasts, by Access 2020-2030 ($Billion)
        • 6.6.8.4 Rest of Middle East & Africa Social Commerce Market Estimates & Forecasts, by Platform 2020-2030 ($Billion)

  • Chapter 7 Competitive Landscape

    • 7.1 Social Commerce Market – Growth Innovation Matrix
    • 7.2 Social Commerce Market – Mergers & Acquisitions
    • 7.3 Social Commerce Market – Company Profiles

  • Chapter 8 Company Profiles

    • 8.1 Beijing ByteDance Technology Co Ltd.
    • 8.2 Meta Platforms Inc.
    • 8.3 PDD Holdings Inc.
    • 8.4 Pinterest Inc.
    • 8.5 Poshmark Inc.
    • 8.6 Snap Inc.
    • 8.7 Tencent Holdings Ltd.
    • 8.8 Twitter Inc.
    • 8.9 Yunji Inc.

Figures

  • Fig 1: Social Commerce Market Snapshot
  • Fig 2: Social Commerce Market – Segmentation
  • Fig 3: Social Commerce Market – Product Overview
  • Fig 4: Social Commerce Market – Revenue Opportunity Forecast, by Region 2020-2030 ($Billion)
  • Fig 5: Social Commerce Market, by Estimates & Forecasts, 2020-2030 ($Billion)
  • Fig 6: Social Commerce Market Share Estimates & Forecasts, by Product, 2020-2030 (%)
  • Fig 7: Social Commerce Market Share Estimates & Forecasts, by Access, 2020-2030 (%)
  • Fig 8: Social Commerce Market Share Estimates & Forecasts, by Platform, 2020-2030 (%)
  • Fig 9: North America Social Commerce Market Estimates & Forecasts, by Country, 2020-2030 ($Billion)
  • Fig 10: North America Social Commerce Market Estimates & Forecasts, 2020-2030 ($Billion)
  • Fig 11: North America Social Commerce Market Estimates & Forecasts, by Product, 2020-2030 ($Billion)
  • Fig 12: North America Social Commerce Market Estimates & Forecasts, by Access, 2020-2030 ($Billion)
  • Fig 13: North America Social Commerce Market Estimates & Forecasts, by Platform, 2020-2030 ($Billion)
  • Fig 14: U.S. Social Commerce Market Estimates & Forecasts, 2020-2030 ($Billion)
  • Fig 15: U.S. Social Commerce Market Estimates & Forecasts, by Product, 2020-2030 ($Billion)
  • Fig 16: US Social Commerce Market Estimates & Forecasts, by Access, 2020-2030 ($Billion)
  • Fig 17: US Social Commerce Market Estimates & Forecasts, by Platform, 2020-2030 ($Billion)
  • Fig 18: Canada Social Commerce Market Estimates & Forecasts, 2020-2030 ($Billion)
  • Fig 19: Canada Social Commerce Market Estimates & Forecasts, by Product, 2020-2030 ($Billion)
  • Fig 20: Canada Social Commerce Market Estimates & Forecasts, by Access, 2020-2030 ($Billion)
  • Fig 21: Canada Social Commerce Market Estimates & Forecasts, by Platform, 2020-2030 ($Billion)
  • Fig 22: Mexico Social Commerce Market Estimates & Forecasts, 2020-2030 ($Billion)
  • Fig 23: Mexico Social Commerce Market Estimates & Forecasts, by Product, 2020-2030 ($Billion)
  • Fig 24: Mexico Social Commerce Market Estimates & Forecasts, by Access, 2020-2030 ($Billion)
  • Fig 25: Mexico Social Commerce Market Estimates & Forecasts, by Platform, 2020-2030 ($Billion)
  • Fig 26: Europe Social Commerce Market Estimates & Forecasts, by Country, 2020-2030 ($Billion)
  • Fig 27: Europe Social Commerce Market Estimates & Forecasts, 2020-2030 ($Billion)
  • Fig 28: Europe Social Commerce Market Estimates & Forecasts, by Product, 2020-2030 ($Billion)
  • Fig 29: Europe Social Commerce Market Estimates & Forecasts, by Access, 2020-2030 ($Billion)
  • Fig 30: Europe Social Commerce Market Estimates & Forecasts, by Platform, 2020-2030 ($Billion)
  • Fig 31: UK Social Commerce Market Estimates & Forecasts, 2020-2030 ($Billion)
  • Fig 32: UK Social Commerce Market Estimates & Forecasts, by Product, 2020-2030 ($Billion)
  • Fig 33: UK Social Commerce Market Estimates & Forecasts, by Access, 2020-2030 ($Billion)
  • Fig 34: UK Social Commerce Market Estimates & Forecasts, by Platform, 2020-2030 ($Billion)
  • Fig 35: Germany Social Commerce Market Estimates & Forecasts, 2020-2030 ($Billion)
  • Fig 36: Germany Social Commerce Market Estimates & Forecasts, by Product, 2020-2030 ($Billion)
  • Fig 37: Germany Social Commerce Market Estimates & Forecasts, by Access, 2020-2030 ($Billion)
  • Fig 38: Germany Social Commerce Market Estimates & Forecasts, by Platform, 2020-2030 ($Billion)
  • Fig 39: France Social Commerce Market Estimates & Forecasts, 2020-2030 ($Billion)
  • Fig 40: France Social Commerce Market Estimates & Forecasts, by Product, 2020-2030 ($Billion)
  • Fig 41: France Social Commerce Market Estimates & Forecasts, by Access, 2020-2030 ($Billion)
  • Fig 42: France Social Commerce Market Estimates & Forecasts, by Platform, 2020-2030 ($Billion)
  • Fig 43: Netherlands Social Commerce Market Estimates & Forecasts, 2020-2030 ($Billion)
  • Fig 44: Netherlands Social Commerce Market Estimates & Forecasts, by Product, 2020-2030 ($Billion)
  • Fig 45: Netherlands Social Commerce Market Estimates & Forecasts, by Access, 2020-2030 ($Billion)
  • Fig 46: Netherlands Social Commerce Market Estimates & Forecasts, by Platform, 2020-2030 ($Billion)
  • Fig 47: Italy Social Commerce Market Estimates & Forecasts, 2020-2030 ($Billion)
  • Fig 48: Italy Social Commerce Market Estimates & Forecasts, by Product, 2020-2030 ($Billion)
  • Fig 49: Italy Social Commerce Market Estimates & Forecasts, by Access, 2020-2030 ($Billion)
  • Fig 50: Italy Social Commerce Market Estimates & Forecasts, by Platform, 2020-2030 ($Billion)
  • Fig 51: Spain Social Commerce Market Estimates & Forecasts, 2020-2030 ($Billion)
  • Fig 52: Spain Social Commerce Market Estimates & Forecasts, by Product, 2020-2030 ($Billion)
  • Fig 53: Spain Social Commerce Market Estimates & Forecasts, by Access, 2020-2030 ($Billion)
  • Fig 54: Spain Social Commerce Market Estimates & Forecasts, by Platform, 2020-2030 ($Billion)
  • Fig 55: Belgium Social Commerce Market Estimates & Forecasts, 2020-2030 ($Billion)
  • Fig 56: Belgium Social Commerce Market Estimates & Forecasts, by Product, 2020-2030 ($Billion)
  • Fig 57: Belgium Social Commerce Market Estimates & Forecasts, by Access, 2020-2030 ($Billion)
  • Fig 58: Belgium Social Commerce Market Estimates & Forecasts, by Platform, 2020-2030 ($Billion)
  • Fig 59: Rest of Europe Social Commerce Market Estimates & Forecasts, 2020-2030 ($Billion)
  • Fig 60: Rest of Europe Social Commerce Market Estimates & Forecasts, by Product, 2020-2030 ($Billion)
  • Fig 61: Rest of Europe Social Commerce Market Estimates & Forecasts, by Access, 2020-2030 ($Billion)
  • Fig 62: Rest of Europe Social Commerce Market Estimates & Forecasts, by Platform, 2020-2030 ($Billion)
  • Fig 63: Asia Pacific Social Commerce Market Estimates & Forecasts, by Country, 2020-2030 ($Billion)
  • Fig 64: Asia Pacific Social Commerce Market Estimates & Forecasts, 2020-2030 ($Billion)
  • Fig 65: Asia Pacific Social Commerce Market Estimates & Forecasts, by Product, 2020-2030 ($Billion)
  • Fig 66: Asia Pacific Social Commerce Market Estimates & Forecasts, by Access, 2020-2030 ($Billion)
  • Fig 66: Asia Pacific Social Commerce Market Estimates & Forecasts, by Platform, 2020-2030 ($Billion)
  • Fig 67: China Social Commerce Market Estimates & Forecasts, 2020-2030 ($Billion)
  • Fig 68: China Social Commerce Market Estimates & Forecasts, by Product, 2020-2030 ($Billion)
  • Fig 69: China Social Commerce Market Estimates & Forecasts, by Access, 2020-2030 ($Billion)
  • Fig 70: China Social Commerce Market Estimates & Forecasts, by Platform, 2020-2030 ($Billion)
  • Fig 71: India Social Commerce Market Estimates & Forecasts, 2020-2030 ($Billion)
  • Fig 72: India Social Commerce Market Estimates & Forecasts, by Product, 2020-2030 ($Billion)
  • Fig 73: India Social Commerce Market Estimates & Forecasts, by Access, 2020-2030 ($Billion)
  • Fig 74: India Social Commerce Market Estimates & Forecasts, by Platform, 2020-2030 ($Billion)
  • Fig 75: Japan Social Commerce Market Estimates & Forecasts, 2020-2030 ($Billion)
  • Fig 76: Japan Social Commerce Market Estimates & Forecasts, by Product, 2020-2030 ($Billion)
  • Fig 77: Japan Social Commerce Market Estimates & Forecasts, by Access, 2020-2030 ($Billion)
  • Fig 78: Japan Social Commerce Market Estimates & Forecasts, by Platform, 2020-2030 ($Billion)
  • Fig 79: South Korea Social Commerce Market Estimates & Forecasts, 2020-2030 ($Billion)
  • Fig 80: South Korea Social Commerce Market Estimates & Forecasts, by Product, 2020-2030 ($Billion)
  • Fig 81: South Korea Social Commerce Market Estimates & Forecasts, by Access, 2020-2030 ($Billion)
  • Fig 82: South Korea Social Commerce Market Estimates & Forecasts, by Platform, 2020-2030 ($Billion)
  • Fig 83: Australia Social Commerce Market Estimates & Forecasts, 2020-2030 ($Billion)
  • Fig 84: Australia Social Commerce Market Estimates & Forecasts, by Product, 2020-2030 ($Billion)
  • Fig 85: Australia Social Commerce Market Estimates & Forecasts, by Access, 2020-2030 ($Billion)
  • Fig 86: Australia Social Commerce Market Estimates & Forecasts, by Platform, 2020-2030 ($Billion)
  • Fig 87: Singapore Social Commerce Market Estimates & Forecasts, 2020-2030 ($Billion)
  • Fig 88: Singapore Social Commerce Market Estimates & Forecasts, by Product, 2020-2030 ($Billion)
  • Fig 89: Singapore Social Commerce Market Estimates & Forecasts, by Access, 2020-2030 ($Billion)
  • Fig 90: Singapore Social Commerce Market Estimates & Forecasts, by Platform, 2020-2030 ($Billion)
  • Fig 91: Philippines Social Commerce Market Estimates & Forecasts, 2020-2030 ($Billion)
  • Fig 92: Philippines Social Commerce Market Estimates & Forecasts, by Product, 2020-2030 ($Billion)
  • Fig 93: Philippines Social Commerce Market Estimates & Forecasts, by Access, 2020-2030 ($Billion)
  • Fig 94: Philippines Social Commerce Market Estimates & Forecasts, by Platform, 2020-2030 ($Billion)
  • Fig 95: Malaysia Social Commerce Market Estimates & Forecasts, 2020-2030 ($Billion)
  • Fig 96: Malaysia Social Commerce Market Estimates & Forecasts, by Product, 2020-2030 ($Billion)
  • Fig 97: Malaysia Social Commerce Market Estimates & Forecasts, by Access, 2020-2030 ($Billion)
  • Fig 98: Malaysia Social Commerce Market Estimates & Forecasts, by Platform, 2020-2030 ($Billion)
  • Fig 99: Indonesia Social Commerce Market Estimates & Forecasts, 2020-2030 ($Billion)
  • Fig 100: Indonesia Social Commerce Market Estimates & Forecasts, by Product, 2020-2030 ($Billion)
  • Fig 101: Indonesia Social Commerce Market Estimates & Forecasts, by Access, 2020-2030 ($Billion)
  • Fig 102: Indonesia Social Commerce Market Estimates & Forecasts, by Platform, 2020-2030 ($Billion)
  • Fig 103: Thailand Social Commerce Market Estimates & Forecasts, 2020-2030 ($Billion)
  • Fig 104: Thailand Social Commerce Market Estimates & Forecasts, by Product, 2020-2030 ($Billion)
  • Fig 105: Thailand Social Commerce Market Estimates & Forecasts, by Access, 2020-2030 ($Billion)
  • Fig 106: Thailand Social Commerce Market Estimates & Forecasts, by Platform, 2020-2030 ($Billion)
  • Fig 107: Vietnam Social Commerce Market Estimates & Forecasts, 2020-2030 ($Billion)
  • Fig 108: Vietnam Social Commerce Market Estimates & Forecasts, by Product, 2020-2030 ($Billion)
  • Fig 109: Vietnam Social Commerce Market Estimates & Forecasts, by Access, 2020-2030 ($Billion)
  • Fig 110: Vietnam Social Commerce Market Estimates & Forecasts, by Platform, 2020-2030 ($Billion)
  • Fig 111: Rest of Asia Pacific Social Commerce Market Estimates & Forecasts, 2020-2030 ($Billion)
  • Fig 112: Rest of Asia Pacific Social Commerce Market Estimates & Forecasts, by Product, 2020-2030 ($Billion)
  • Fig 113: Rest of Asia Pacific Social Commerce Market Estimates & Forecasts, by Access, 2020-2030 ($Billion)
  • Fig 114: Rest of Asia Pacific Social Commerce Market Estimates & Forecasts, by Platform, 2020-2030 ($Billion)
  • Fig 115: South & Central America Social Commerce Market Estimates & Forecasts, by Country, 2020-2030 ($Billion)
  • Fig 116: South & Central America Social Commerce Market Estimates & Forecasts, 2020-2030 ($Billion)
  • Fig 117: South & Central America Social Commerce Market Estimates & Forecasts, by Product, 2020-2030 ($Billion)
  • Fig 118: South & Central America Social Commerce Market Estimates & Forecasts, by Access, 2020-2030 ($Billion)
  • Fig 119: South & Central America Social Commerce Market Estimates & Forecasts, by Platform, 2020-2030 ($Billion)
  • Fig 120: Brazil Social Commerce Market Estimates & Forecasts, 2020-2030 ($Billion)
  • Fig 121: Brazil Social Commerce Market Estimates & Forecasts, by Product, 2020-2030 ($Billion)
  • Fig 122: Brazil Social Commerce Market Estimates & Forecasts, by Access, 2020-2030 ($Billion)
  • Fig 123: Brazil Social Commerce Market Estimates & Forecasts, by Platform, 2020-2030 ($Billion)
  • Fig 124: Argentina Social Commerce Market Estimates & Forecasts, 2020-2030 ($Billion)
  • Fig 125: Argentina Social Commerce Market Estimates & Forecasts, by Product, 2020-2030 ($Billion)
  • Fig 126: Argentina Social Commerce Market Estimates & Forecasts, by Access, 2020-2030 ($Billion)
  • Fig 127: Argentina Social Commerce Market Estimates & Forecasts, by Platform, 2020-2030 ($Billion)
  • Fig 128: Rest of South & Central America Social Commerce Market Estimates & Forecasts, 2020-2030 ($Billion)
  • Fig 129: Rest of South & Central America Social Commerce Market Estimates & Forecasts, by Product, 2020-2030 ($Billion)
  • Fig 130: Rest of South & Central America Social Commerce Market Estimates & Forecasts, by Access, 2020-2030 ($Billion)
  • Fig 131: Rest of South & Central America Social Commerce Market Estimates & Forecasts, by Platform, 2020-2030 ($Billion)
  • Fig 132: Middle East & Africa Social Commerce Market Estimates & Forecasts, by Country, 2020-2030 ($Billion)
  • Fig 133: Middle East & Africa Social Commerce Market Estimates & Forecasts, 2020-2030 ($Billion)
  • Fig 134: Middle East & Africa Social Commerce Market Estimates & Forecasts, by Product, 2020-2030 ($Billion)
  • Fig 135: Middle East & Africa Social Commerce Market Estimates & Forecasts, by Access, 2020-2030 ($Billion)
  • Fig 136: Middle East & Africa Social Commerce Market Estimates & Forecasts, by Platform, 2020-2030 ($Billion)
  • Fig 137: Saudi Arabia Social Commerce Market Estimates & Forecasts, 2020-2030 ($Billion)
  • Fig 138: Saudi Arabia Social Commerce Market Estimates & Forecasts, by Product, 2020-2030 ($Billion)
  • Fig 139: Saudi Arabia Social Commerce Market Estimates & Forecasts, by Access, 2020-2030 ($Billion)
  • Fig 140: Saudi Arabia Social Commerce Market Estimates & Forecasts, by Platform, 2020-2030 ($Billion)
  • Fig 141: South Africa Social Commerce Market Estimates & Forecasts, 2020-2030 ($Billion)
  • Fig 142: South Africa Social Commerce Market Estimates & Forecasts, by Product, 2020-2030 ($Billion)
  • Fig 143: South Africa Social Commerce Market Estimates & Forecasts, by Access, 2020-2030 ($Billion)
  • Fig 144: South Africa Social Commerce Market Estimates & Forecasts, by Platform, 2020-2030 ($Billion)
  • Fig 145: United Arab Emirates Social Commerce Market Estimates & Forecasts, 2020-2030 ($Billion)
  • Fig 146: United Arab Emirates Social Commerce Market Estimates & Forecasts, by Product, 2020-2030 ($Billion)
  • Fig 147: United Arab Emirates Social Commerce Market Estimates & Forecasts, by Access, 2020-2030 ($Billion)
  • Fig 148: United Arab Emirates Social Commerce Market Estimates & Forecasts, by Platform, 2020-2030 ($Billion)
  • Fig 149: Rest of Middle East & Africa Social Commerce Market Estimates & Forecasts, 2020-2030 ($Billion)
  • Fig 150: Rest of Middle East & Africa Social Commerce Market Estimates & Forecasts, by Product, 2020-2030 ($Billion)
  • Fig 151: Rest of Middle East & Africa Social Commerce Market Estimates & Forecasts, by Access, 2020-2030 ($Billion)
  • Fig 152: Rest of Middle East & Africa Social Commerce Market Estimates & Forecasts, by Platform, 2020-2030 ($Billion)

Frequently asked questions

Currency USD
$3,950

Can be used by individual purchaser only

$7,950

Can be shared globally by unlimited users within the purchasing corporation e.g. all employees of a single company


Undecided about purchasing this report?

Enquire Before Buying Download FREE Resources

Get in touch to find out about multi-purchase discounts

reportstore@globaldata.com
Tel +44 20 7947 2745

Sample Report

We are confident about Social Commerce Market Size, Share, Trends and Analysis by Region, Product, Access, Platform and Segment Forecast to 2030 report's unique quality. However, we want you to make the most beneficial decision for your business, so we offer free sample pages to help you:

  • Assess the relevance of the report
  • Evaluate the quality of the report
  • Justify the cost

Download your copy of the sample report and make an informed decision about whether the full report will provide you with the insights and information you need.

Below is a sample report to understand what you are buying

See what our customers are saying
testimonial-image
testimonial-image
testimonial-image
testimonial-image
testimonial-image
testimonial-image
testimonial-image

“The GlobalData platform is our go-to tool for intelligence services. GlobalData provides an easy way to access comprehensive intelligence data around multiple sectors, which essentially makes it a one-for-all intelligence platform, for tendering and approaching customers.

GlobalData is very customer orientated, with a high degree of personalised services, which benefits everyday use. The highly detailed project intelligence and forecast reports can be utilised across multiple departments and workflow scopes, from operational to strategic level, and often support strategic decisions. GlobalData Analytics and visualisation solutions has contributed positively when preparing management presentations and strategic papers.”

Business Intelligence & Marketing Manager, SAL Heavy Lift

“COVID-19 has caused significant interference to our business and the COVID-19 intelligence from GlobalData has helped us reach better decisions around strategy. These two highlights have helped enormously to understand the projections into the future concerning our business units, we also utilise the project database to source new projects for Liebherr-Werk to use as an additional source to pitch for new business.”

Market Analyst & Management, Liebherr-Werk

Your daily news has saved me a lot of time and keeps me up-to-date with what is happening in the market, I like that you almost always have a link to the source origin. We also use your market data in our Strategic Business Process to support our business decisions. By having everything in one place on the Intelligence Center it has saved me a lot of time versus looking on different sources, the alert function also helps with this.

Head of Key Accounts, Saab AB

Having used several other market research companies, I find that GlobalData manages to provide that ‘difficult-to-get’ market data that others can’t, as well as very diverse and complete consumer surveys.

Marketing Intelligence Manager, Portugal Foods

Our experience with GlobalData has been very good, from the platform itself to the people. I find that the analysts and the account team have a high level of customer focus and responsiveness and therefore I can always rely on. The platform is more holistic than other providers. It is convenient and almost like a one stop shop. The pricing suite is highly competitive and value for our organisation.

I like reports that inform new segments such as the analysis on generation Z, millennials, the impact of COVID 19 to our banking customers and their new channel habits. Secondly the specialist insight on affluent sector significantly increases our understanding about this group of customers. The combination of those give us depth and breadth of the evolving market.

I’m in the business of answering and helping people make decisions so with the intelligence center I can do that, effectively and efficiently. I can share quickly key insights that answer and satisfy our country stakeholders by giving them many quality studies and primary research about competitive landscape beyond the outlook of our bank. It helps me be seen as an advisory partner and that makes a big difference. A big benefit of our subscription is that no one holds the whole data and because it allows so many people, so many different parts of our organisation have access, it enables all teams to have the same level of knowledge and decision support.

Head of Customer Insight and Research, Standard Chartered

“I know that I can always rely on Globaldata’s work when I’m searching for the right consumer and market insights. I use Globaldata insights to understand the changing market & consumer landscape and help create better taste & wellbeing solutions for our customers in food, beverage and healthcare industries.

Globaldata has the right data and the reports are of very high quality compared to your competitors. Globaldata not only has overall market sizes & consumer insights on food & beverages but also provides insights at the ingredient & flavour level. That is key for B2B companies like Givaudan. This way we understand our customers’ business and also gain insight to our unique industry”

Head of Consumer Sensory Insights, Givaudan

GlobalData provides a great range of information and reports on various sectors that is highly relevant, timely, easy to access and utilise.  The reports and data dashboards help engagement with clients; they provide valuable industry and market insights that can enrich client conversations and can help in the shaping of value propositions. Moreover, using GlobalData products has helped increase my knowledge of the finance sector, the players within it, and the general threats and opportunities.

I find the consumer surveys that are carried out to be extremely beneficial and not something I have seen anywhere else. They provided an insightful view of why and which consumers take (or don’t) particular financial products. This can help shape conversations with clients to ensure they make the right strategic decisions for their business.

One of the challenges I have found is that data in the payments space is often piecemeal. With GD all of the data I need is in one place, but it also comes with additional market reports that provide useful extra context and information. Having the ability to set-up alerts on relevant movements in the industry, be it competitors or customers, and have them emailed directly to me, ensures I get early sight of industry activity and don’t have to search for news.

Senior Account Manager, TSYS
Financial Services
New
UK Insurance Aggregators 2026
$3,450 | June 2026
Financial Services
New
Kenya Cards and Payments: Opportunities and Risks to 2030
$2,750 | June 2026
Financial Services
New
Hungary Cards and Payments: Opportunities and Risks to 2030
$2,750 | June 2026
Go even deeper with GlobalData Intelligence Center

Every Company Report we produce is powered by the GlobalData Intelligence Center.

Subscribing to our intelligence platform means you can monitor developments at Social Commerce Market Size, Share, Trends and Analysis by Region, Product, Access, Platform and Segment Forecast to 2030 in real time.

  • Access a live Social Commerce Market Size, Share, Trends and Analysis by Region, Product, Access, Platform and Segment Forecast to 2030 dashboard for 12 months, with up-to-the-minute insights.
  • Fuel your decision making with real-time deal coverage and media activity.
  • Turn insights on financials, deals, products and pipelines into powerful agents of commercial advantage.