South-East Asia Infrastructure Construction Market Size and Trends Analysis by Countries, Sector and Segment 2022-2026
Powered by ![]()
Access in-depth insight and stay ahead of the market

Explore actionable market insights from the following data in our ‘South-East Asia Infrastructure Market’ report:
- Analysis of historical figures and forecasts of revenue opportunities from the sector (roads, railways, electricity and power, water and sewage, and others) and regional segments.
- Outlook for the South-East Asia infrastructure construction industry to 2026.
- Analysis of the infrastructure investment in major countries: Indonesia, Malaysia, Philippines, Singapore, Thailand, Vietnam, and the Rest of South-East Asia.
- Insight into the project pipelines for sectors such as roads and railways.
How is the ‘South-East Asia Infrastructure Market’ report different from other reports in the market?
Businesses need to have a deeper understanding of the market dynamics to gain a competitive edge in the coming decade. Get the ‘South-East Asia Infrastructure Market’ report today, which will help you to:
- Evaluate regional trends in infrastructure development from insight into output values and project pipelines. Identify the fastest growers to enable assessment and targeting of commercial opportunities in the markets best suited to strategic focus.
- Identify the drivers in the South-East Asia infrastructure construction market and consider growth in developed economies. Formulate plans on where and how to engage with the market while minimizing any negative impact on revenues.
- Examine the assumptions and drivers behind ongoing and upcoming trends in the South-East Asia infrastructure construction market.
We recommend this valuable source of information to anyone involved in:
- Contractors Including Civil Works, Electrical, HVAC, and Others
- Consultants/Designers
- Building Material Merchants/Players
- Management Consultants and Investment Banks
- Portfolio Managers/Buy-Side Firms
- Strategy and Business Development
- Investment Banking
To Get a Snapshot of the South-East Asia Infrastructure Market Report, Download a Free Report Sample
South-East Asia Infrastructure Construction Market Overview
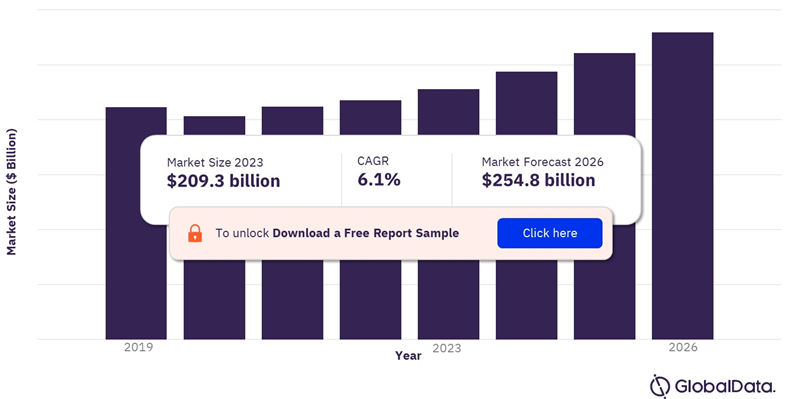
The South-East Asia infrastructure construction market size will be valued at $209.3 billion in 2023 and is expected to grow at a compound annual growth rate (CAGR) of 6.1% over the forecast period. The rising need to provide an efficient infrastructure to the growing population of the region is expected to drive the market growth over the forecast period.
The significant volume of metro, tube and light rail developments in the region is unsurprising given South-East Asia’s rapid urbanization and robust population growth. Insufficient urban rail transit coverage has exacerbated traffic congestion in the region, generating significant economic costs for many South-East Asian economies.
South-East Asia Infrastructure Construction Market Outlook, 2019-26 ($ Billion)
View Sample Report for Additional Insights on the South-East Asia Infrastructure Construction Market Forecast, Download a Free Report Sample
According to estimates from GlobalData, the South-East Asia infrastructure construction market observed a decline of 4.2% in 2020 owing to the imposed lockdowns and disrupted economic activities caused with the emergence of coronavirus. The year-on-year (Y-o-Y) growth was estimated at 2.9% in 2021 primarily driven by the astonishing outputs from Singapore and Philippines. For instance, in 2021, Singapore’s infrastructure construction industry witnessed a y-o-y growth of more than 26.0% followed by Philippines at approximately 12.0%.
South-East Asia Infrastructure Construction Market Segmentation by Sectors
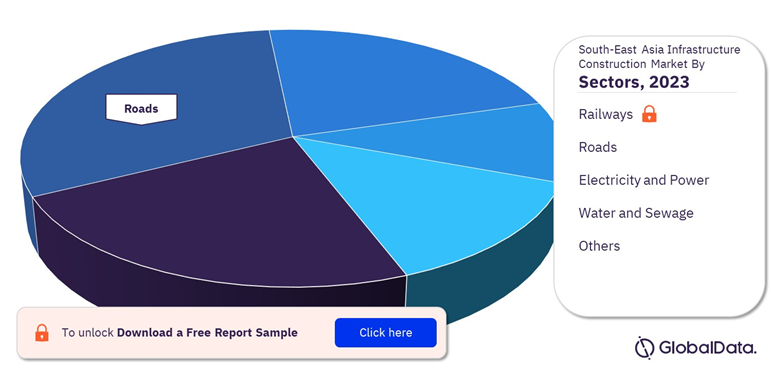
The South-East Asia infrastructure construction industry covers railways, roads, water and sewage, electricity and power, and others. The roads segment is anticipated to dominate the overall market share in 2022.
Roads: This sector in terms of construction output value dominated the overall market share accounting for 30.7% in 2022 and is expected to register an annual average growth rate of 6.6% from 2023 to 2026. Indonesia records the highest-value pipeline in the region, of which a substantial proportion is recorded for the $37.0 billion Trans-Sumatra High-Grade Highway development..
In the years ahead, demand for road construction in Indonesia will be driven by works under the National Medium-Term Development Plan, as part of which, the government plans to develop 5,000km of new toll roads and 3,000km of new national roads by 2024.
South-East Asia Infrastructure Construction Market Share by Sectors, 2023 (%)
Fetch Sample PDF for South-East Asia Infrastructure Construction Segment-specific Revenues and Shares, Download a Free Report Sample
Railways: The regional railway infrastructure construction sector in terms of construction output value is dominated by Indonesia, accounting for a share of more than 63.0% in 2022. Within Indonesia, steady growth is expected over the forecast period primarily backed by sturdy project pipeline and ongoing development sites. For instance, in January 2023, the Indonesian government announced it plans to invest IDR3.2 trillion ($205.3 million) to help a consortium of Indonesian and Chinese state companies complete a 142km high-speed railway line project. The project is expected to be completed by 2023.
Electricity and Power: The electricity and power segment in terms of output value is estimated to observe an annual average growth rate of 6.7% from 2023 to 2026. Within regional dynamics, Indonesia aims to shift away from fossil fuels and reach net-zero carbon emissions by 2060 or sooner, but coal remains a cheap and reliable source of energy and usage is unlikely to fall dramatically in the next five years.
High population growth and economic growth has put pressure on Vietnam’s energy market as demand currently exceeds supply. Historically Vietnam has relied on coal to meet the shortfall in supply. However, as part of Vietnam’s ‘green’ transition natural gas is increasingly seen as a more viable alternative to coal. LNG import terminals and power plants are increasing as coal-fired power plants are gradually being phased out.
Water and Sewage: This segment is projected to observe the smallest regional market share over the forecast period. Despite the growing water scarcity owing to rise in population, rapid urbanization, and climate change, the annual average growth is anticipated to remain 4.0% from 2023 to 2026. Malaysia is among the leading countries of the region in terms of project pipeline value of water and sewage sites. In September 2022, the water and wastewater engineering firm Salcon Bhd secured a 27-month contract worth MYR210 million ($48.9 million) for the proposed development of the Langat 2 Water Treatment Plant and Water Reticulation System in Selangor and Kuala Lumpur (KL).
Others: The others category comprises marine, ports, inland waterways, and airports. The persistence of the COVID-19 pandemic in South-East Asia continues to disrupt both international and domestic travel, with losses at airlines and airport operators continuing to mount. Tourist arrivals have begun to recover in 2022 but remain significantly below 2019 levels, owing partially to the zero-COVID policy maintained by China, which accounts for a large share of arrivals to the region.
Growth in the footfall of passengers in the region are likely to drive the segmental market growth over the forecast period. The largest project in the pipeline is the Bulacan International Airport in Central Luzon, Philippines. Valued at $14.5 billion, the project includes the construction of a new airport complex consisting of four runways, a terminal building, and transport links. The airport will have a per annum capacity of 200 million passengers.
South-East Asia Infrastructure Construction Market Analysis by Countries
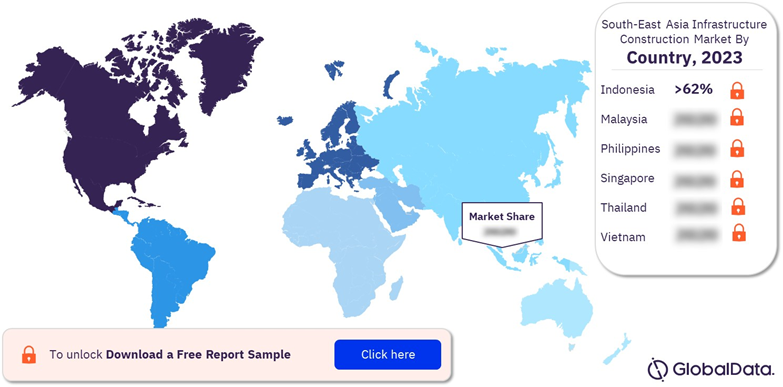
Indonesia is projected to remain the front runner within the overall infrastructure construction sector of South-East Asia, accounting for more than 62.0% in 2022. In the 2023 State Budget, the government allocated IDR392 trillion ($25.8 billion) for infrastructure development in 2023, a 7.8% increase from the 2022 Budget allocation of IDR363.8 trillion ($23.8 billion). The state budget will be utilized to establish important facilities such as basic infrastructure and will also be used to develop the new capital city (IKN) in East Kalimantan province in 2023.
Vietnam is anticipated to occupy the second place following Indonesia in terms of regional market share in 2022. In terms of project pipeline, Vietnam is expected to dominate the regional dynamics over the predicted timeline. The development and commencement of infrastructure projects in the country are likely to aid the growth of the sector. For instance, the construction of Dai Ngai Bridge is scheduled to commence in the first quarter of 2023, according to the Ministry of Transport. This is a 15.1km project that includes seven bridges and five intersections, with the Dai Ngai Bridge being the main component. With an estimated cost of VND8 trillion ($342.9 million), the project is expected to be completed in 2026.
Philippines is projected to register the fastest compounded annual growth rate of 9.1% over the forecast period. The government’s plan to improve regional connectivity through the development of transport infrastructure is anticipated to remain a key driver. The government’s allocation of PHP1.2 trillion ($22.6 billion) as part of the 2023 Budget will support the development of infrastructure projects in 2023.
Over the remainder of the forecast period, the Philippine’s outlook will be supported by progress on a number of key transport projects in the BBM program and the government’s effort to develop a sustainable transport system. The construction of the North-South Commuter Railway (NSCR) project, with a total investment of PHP744.6 billion ($14 billion) by 2028, will underpin construction activity in the sector over the forecast period.
South-East Asia Infrastructure Construction Market Share by Country, 2023 (%)
View Sample Report for Additional South-East Asia Infrastructure Construction Market Insights, Download a Free Report Sample
Malaysia and Thailand are estimated to occupy almost equivalent regional market share in 2022. However, Malaysia is expected to showcase 6.4% of annual average growth rate from 2023 to 2026 and Thailand is likely to record 4.7% over the same timeline. The government of Malaysia is keenly focusing on the maintenance of its federal roadway network. For instance, in August 2022, the Minister of the Infrastructure Development Cluster and Works Fadillah bin Yusof announced an allocation of MYR1.8 billion ($419 million) for the maintenance of federal roads throughout Malaysia for 2022.
South-East Asia Infrastructure Construction Market Research Scope
| Market Size in 2023 | $209.3 billion |
| Market Size in 2026 | $254.8 billion |
| CAGR | 6.1% from 2022 to 2026 |
| Historic Years | 2016-2021 |
| Forecast Period | 2022-2026 |
| Report Scope & Coverage | Sector Overview, Construction Output Value ($ Million), Project Pipeline by Country and Sector, Regional Outlook by Key Sectors, Top 20 Project Details by Sector |
| Key Segments | Roads, Railways, Electricity and Power, Water and Sewage, Others |
| Key Countries | Indonesia, Malaysia, Philippines, Singapore, Thailand, Vietnam, and Rest of South-East Asia |
Key Players
Table of Contents
Table
Figures
Frequently asked questions
-
What was the South-East Asia infrastructure construction market size in 2023?
The infrastructure construction market size in South-East Asia will be valued at $209.3 billion in 2023.
-
What is the South-East Asia infrastructure construction market growth rate?
The infrastructure construction market in South-East Asia is expected to grow at a CAGR of 6.1% during 2022-2026.
-
What are the key sectors in the South-East Asia infrastructure construction market?
The key sectors in the South-East Asia infrastructure construction market are roads, railways, electricity and power, water and sewage, and others.
-
Which are the key countries in the South-East Asia infrastructure construction market?
The key countries in the South-East Asia infrastructure construction market are Indonesia, Malaysia, Philippines, Singapore, Thailand, Vietnam, and Rest of South-East Asia.
-
Is there a third level of segmentation in the report?
GlobalData’s focus is on providing reliable and accurate data that is supported by robust research methodology. Our reports undergo rigorous quality checks and are based on primary and secondary research sources, ensuring that the numbers and insights provided are trustworthy. However, despite the best efforts to gather comprehensive data, there could be instances where the available data is limited, making it challenging to provide third level segmentation. In such cases, GlobalData may choose to provide high-level insights and general trends rather than forcing segmentation that may not be backed by sufficient data. This approach ensures that the report’s overall quality and credibility are maintained.
Get in touch to find out about multi-purchase discounts
reportstore@globaldata.com
Tel +44 20 7947 2745
Every customer’s requirement is unique. With over 220,000 construction projects tracked, we can create a tailored dataset for you based on the types of projects you are looking for. Please get in touch with your specific requirements and we can send you a quote.
Sample Report
We are confident about South-East Asia Infrastructure Construction Market Size and Trends Analysis by Countries, Sector and Segment 2022-2026 report's unique quality. However, we want you to make the most beneficial decision for your business, so we offer free sample pages to help you:
- Assess the relevance of the report
- Evaluate the quality of the report
- Justify the cost
Download your copy of the sample report and make an informed decision about whether the full report will provide you with the insights and information you need.


