Automotive Autonomous Driving Systems Market Trends, Sector Overview and Forecast to 2028
Powered by ![]()
All the vital news, analysis, and commentary curated by our industry experts.

Automotive Autonomous Driving Systems Market Report Overview
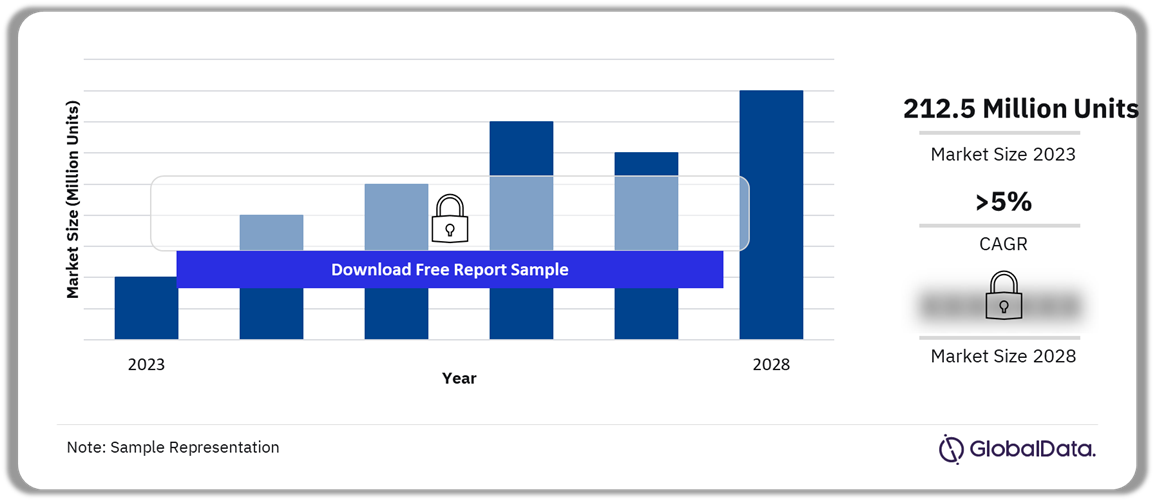
The automotive autonomous driving systems market size was 212.5 million units in 2023. The market will grow at a CAGR of more than 5% during 2023-2028. Improving road safety is one of the primary drivers of autonomous driving systems. In 2023, Asia-Pacific accounted for a significant share of the market.
Automotive Autonomous Driving Systems Market Outlook, 2023-2028 (Million Units)
Buy the Full Report for More Insights into the Automotive Autonomous Driving Systems Market
The automotive autonomous driving systems market research report provides a comprehensive overview of the advanced driver assistance systems market trends and drivers. The report also provides a detailed overview of technological developments and innovations, PESTER analysis, and leading component suppliers at a global and regional level. Furthermore, evaluate strategic initiatives taken by market players and their recent product innovations to identify growth opportunities. The report also provides an overview of patent filings in the sector across regions, countries, and top applicants.
| Market Size (2023) | 212.5 million units |
| CAGR (2023-2028) | > 5% |
| Historical Period | 2018-2022 |
| Forecast Period | 2023-2028 |
| Key Regions | Asia-Pacific, Europe, North America, South America, and MEA |
| Key Companies | Audi, BMW, ZF Friedrichshafen, Bosch, and Magna International |
| Key Sectors | ACC, RADAR – LONG RANGE, Radar – SHORT/MEDIUM RANGE, GPS/GNSS UNIT, and Others |
| Enquire & Decide | Discover the perfect solution for your business needs. Enquire now and let us help you make an informed decision before making a purchase. |
Automotive Autonomous Driving Systems Market Trends
The advancements in artificial intelligence (AI) and machine learning (ML) are some of the key trends shaping the automotive autonomous driving systems market.
Continuous advancements in AI and ML algorithms are improving the perception, decision-making, and learning capabilities of autonomous vehicles. Innovations in deep learning, reinforcement learning, and probabilistic modeling enable self-driving cars to navigate complex environments. It helps anticipate potential risks and adapt to diverse driving conditions with greater accuracy and reliability.
Buy the Full Report for More Trend Insights into the Automotive Autonomous Driving Systems Market
Automotive Autonomous Driving Systems Market Segmentation by Regions
In 2023, Asia-Pacific accounted for the highest share among all the regions
The key regions in the automotive autonomous driving systems market are Asia-Pacific, Europe, North America, South America, and MEA. China remains the largest market for autonomous driving systems, with Japan placing a close second. These countries are among the first to get permission for autonomous driving tests. The Japanese government collaborated with regional automakers, suppliers, and research centers from the Universities of Tokyo and Nagoya to permit autonomous vehicle testing on roads. Likewise, Chinese local governments invest in autonomous driving R&D, and companies such as Volvo, Baidu, and BAIC Motor Corporation have received support from the government for future testing.
Automotive Autonomous Driving Systems Market Analysis by Regions, 2023 (%)

Buy the Full Report for More Regional Insights into the Automotive autonomous driving systems Market
Automotive Autonomous Driving Systems Market - Competitive Landscape
A few of the top companies operating in the market are:
- Audi
- BMW
- ZF Friedrichshafen
- Bosch
- Magna International
BMW is taking strategic actions to aid the growth of the automotive autonomous driving systems market. In August 2023, working together for several years, BMW and Innoviz developed highly automated LiDAR imaging technology which will be incorporated into the BMW 7 Series in the coming months. With an emphasis on second-generation LiDAR technology and a B-sample phase—the stage of test driving where the sample is integrated into demo vehicles—the two companies are extending their cooperation.
Automotive Autonomous Driving Systems Market Analysis by Companies

Buy the Full Report to Know More about Major Developments and Strategic Actions of Automotive Autonomous Driving Systems Market Companies
Automotive Autonomous Driving Systems Market Segmentation by Sectors
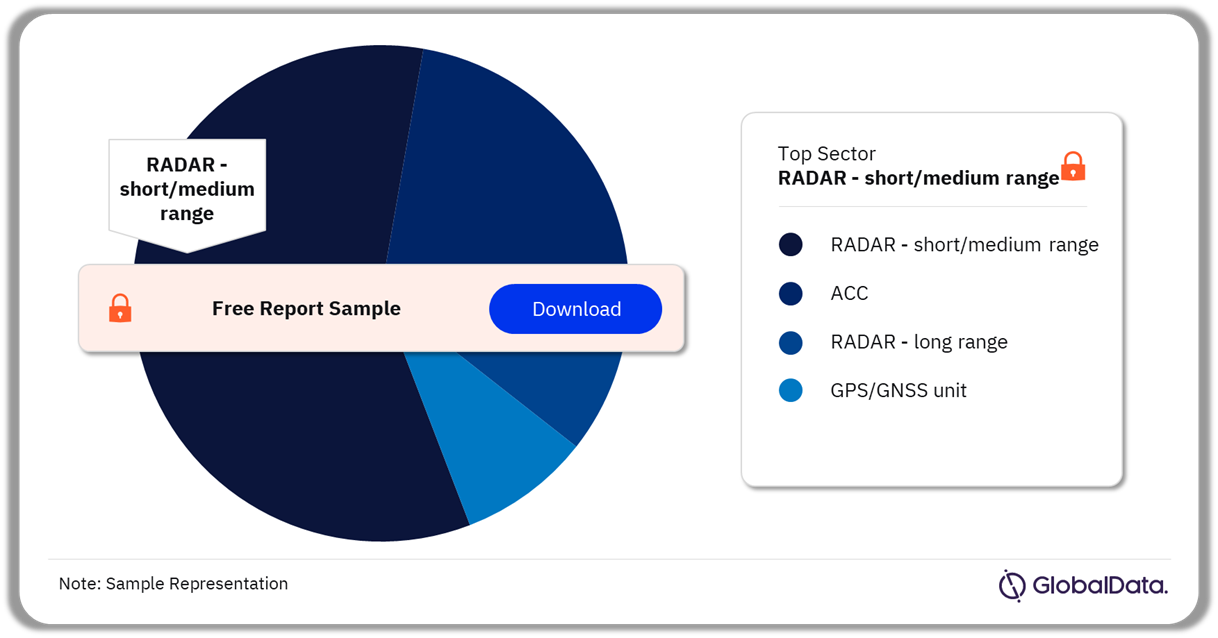
In 2023, radar – short/medium range was the dominant sector in the market.
The key sectors in the automotive autonomous driving systems market are ACC, RADAR – long-range, RADAR – short/medium-range, and GPS/GNSS unit.
Automotive Autonomous Driving Systems Market Analysis by Sectors, 2023 (%)
Buy the Full Report for More Sector Insights into the Automotive Autonomous Driving Systems Market
Automotive Autonomous Driving Systems Market – Latest Developments
A few of the latest developments in the automotive autonomous driving systems market are as follows:
- In 2024, Scania will launch a new autonomous trial. To incorporate Plus technology, based in the US, into Scania and Traton Group vehicles, the company has initiated an “autonomous commercial pilot program”.
- The Grand Duchy of Luxembourg’s government and the autonomous mobility startup Pony.ai have inked a Memorandum of Understanding (MoU) to further the advancement of autonomous mobility in the nation. The purpose of this Memorandum of Understanding is to establish a cooperative relationship between Luxembourg and Pony.ai to promote the development, testing, and use of autonomous vehicles in Luxembourg.
Buy the Full Report to Know More about the Latest Developments in the Automotive Autonomous Driving Systems Market
Segments Covered in the Report
Automotive Autonomous Driving Systems Sector Outlook (Value, Million Units, 2018-2028)
- ACC
- RADAR – long range
- RADAR – short/medium range
- GPS/GNSS unit.
Automotive Autonomous Driving Systems Regional Outlook (Value, Million Units, 2018-2028)
- Asia-Pacific
- Europe
- North America
- South America
- MEA
Scope
This report brings together multiple data sources to provide a comprehensive overview of the global autonomous driving systems sector. It includes an analysis of the following:
- Trends & Drivers: Provides an overview of the current sector scenario regarding the future outlook in terms of key trends and drivers of the sector.
- Technological Developments: Provides a detailed overview of technological developments and innovations in the sector.
- PESTER Analysis: Provides a detailed understanding of various factors such as political, economic, social, technological, environmental, and regulatory impacting the sector.
- Sector Forecast: Provides deep-dive analysis of the global market covering volume growth during 2018–2028, and spot estimates for 2030 and 2036. The analysis also covers a regional overview across four regions-Asia-Pacific, Europe, MEA, North America, and South America -highlighting sector size, and growth drivers for the region.
- Competitive Landscape: Provides an overview of leading component suppliers at a global and regional level, besides analyzing the recent product innovations and key strategic initiatives taken by the companies.
- Patent Analysis: Provides an overview of patent filings in the sector across regions, countries, and top applicants.
Reasons to Buy
- Auto OEMs and component suppliers seek the latest information on how the market is evolving to formulate their sales and marketing strategies. There is also a demand for authentic market data with a high level of detail.
- This report has been created to provide its readers with up-to-date information and analysis to uncover emerging opportunities for growth within the sector in the region.
- The report provides a detailed analysis of the regions and competitive landscape that can help companies gain insight into the region-specific nuances.
- The analysts have also placed a significant emphasis on the key trends that drive customer choice and the future opportunities that can be explored in the region, which can help companies in revenue expansion.
- To gain competitive intelligence about leading component suppliers in the sector in the region with information about their market share and growth rates.
BMW
Bosch
ZF
Magna
Table of Contents
Table
Frequently asked questions
-
What was the automotive autonomous driving systems market size in 2023?
The automotive autonomous driving systems market size was 212.5 million units in 2023.
-
What is the growth rate of the automotive autonomous driving systems market during the forecast period?
The autonomous vehicles market is expected to record a CAGR of more than 5% during 2023-2028.
-
Which was the leading sector in the automotive autonomous driving systems market in 2023?
Radar – short/medium range was the leading sector in the automotive autonomous driving systems market in 2023.
-
Which was the leading region in the automotive autonomous driving systems market in 2023?
Asia-Pacific was the leading revenue generator in the automotive autonomous driving systems market in 2023.
-
Which are the key companies operating in the automotive autonomous driving systems market?
The top companies operating in the automotive autonomous driving systems market are Audi, BMW, ZF Friedrichshafen, Bosch, and Magna International.
Get in touch to find out about multi-purchase discounts
reportstore@globaldata.com
Tel +44 20 7947 2745
Every customer’s requirement is unique. With over 220,000 construction projects tracked, we can create a tailored dataset for you based on the types of projects you are looking for. Please get in touch with your specific requirements and we can send you a quote.
Sample Report
Automotive Autonomous Driving Systems Market Trends, Sector Overview and Forecast to 2028 was curated by the best experts in the industry and we are confident about its unique quality. However, we want you to make the most beneficial decision for your business, so we offer free sample pages to help you:
- Assess the relevance of the report
- Evaluate the quality of the report
- Justify the cost
Download your copy of the sample report and make an informed decision about whether the full report will provide you with the insights and information you need.


