Eastern Europe Construction Market Size, Share, Trends, and Analysis by Sector, Country, and Segment Forecasts to 2028
Powered by ![]()
Access in-depth insight and stay ahead of the market

Accessing the in-depth insights from the ‘Eastern Europe Construction’ report can help:
- Evaluate regional construction output values in Real terms from 2019 to 2028
- Identify the market segments including commercial construction, energy and utilities construction, industrial construction, infrastructure construction, institutional construction, and residential construction
- Foresee shift in the construction landscape of the region based on output values.
- Country-specific overview with top five construction projects listed along with value ($Million)
- Identify key industry participants including contractors and consultants for each of the regional countries
How is our ‘Eastern Europe Construction’ report different from other reports in the market?
- The report explores the different sectors of the construction industry in Eastern Europe through a detailed investigation of the output values from 2019 to 2028.
- The study entails country-specific details covering construction output value in real terms along with a list of projects and key industry participants.
- Detailed segmentation by sector– Commercial Construction, Energy and Utilities Construction, Industrial Construction, Infrastructure Construction, Institutional Construction, and Residential Construction
- Detailed segmentation by country– Azerbaijan, Belarus, Bulgaria, Croatia, Czech Republic, Estonia, Hungary, Kazakhstan, Latvia, Lithuania, Poland, Romania, Russia, Slovakia, Slovenia, Turkey, Ukraine, and Uzbekistan.
- With more than 70+ charts and tables, the report is designed with an easy digestible qualitative content.
- Identify the key growth enablers and target commercial opportunities through a strategic plan.
- Formulate steps to success while leveraging key construction insights from the report.
We recommend this valuable source of information to:
- Contractors Including Civil Works, Electrical, HVAC, and Others
- Consultants/Designers
- Building Material Merchants/Players
- Management Consultants and Investment Banks
- Portfolio Managers/Buy-Side Firms
- Strategy and Business Development
- Investment Banking
Get a Snapshot of the Eastern Europe Market, Download a Free Report Sample
Eastern Europe Construction Market Report Overview
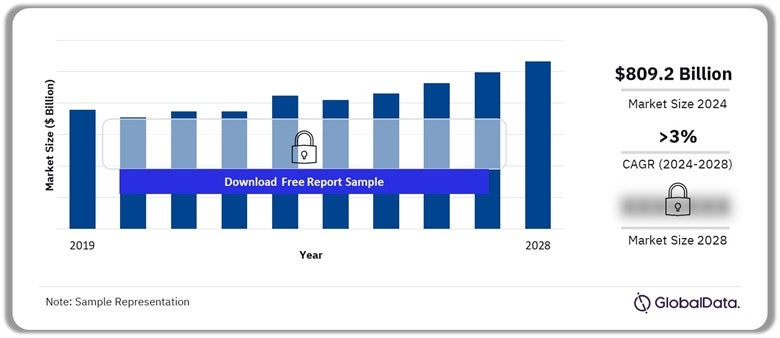
The Eastern Europe construction market size revenue is projected to reach $809.2 billion in 2024 and is expected to grow at a compound annual growth rate (CAGR) of more than 3% over the forecast period. The following are some of the key highlights of the Eastern Europe construction market:
- The regional growth is expected to be supported by investments in the renewable energy, transport, and manufacturing sectors.
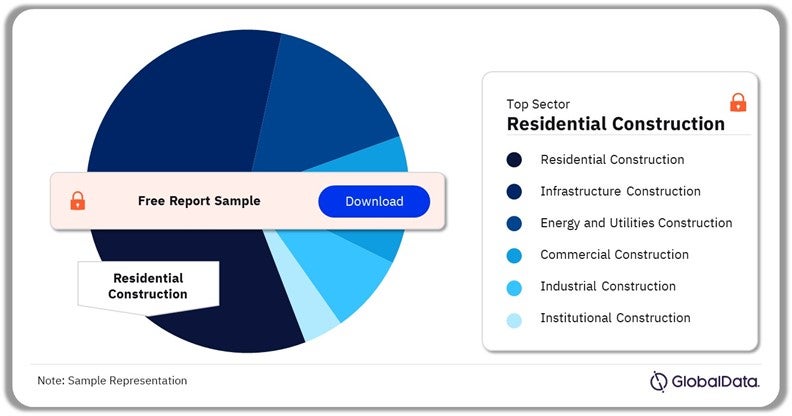
- The residential construction category is set to remain the dominant group in terms of output value (Real) over the forecast period.
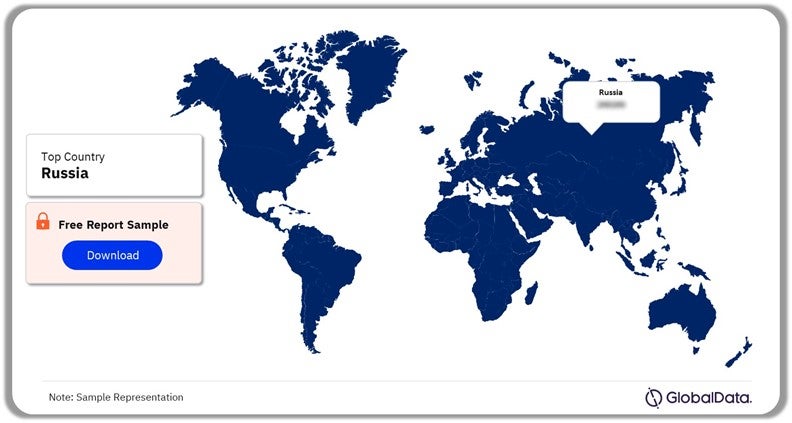
- In the Eastern Europe regional mix, Russia is set to emerge as the dominant country in terms of construction output value (Real) in 2024.
The regional infrastructure construction sector registered a double-digit YoY growth rate in 2023, primarily supported by development works in Azerbaijan, Belarus, Kazakhstan, Romania, Slovenia, and Ukraine. Among these, the highest YoY growth rate particularly in the infrastructure sector was recorded by Ukraine owing to the recovery efforts from the destruction caused due to the ongoing conflict with Russia.
Eastern Europe Construction Market Outlook, 2019-2028 ($Billion)
Buy the Full Report for Additional Insights on the Eastern Europe Construction Market Forecast
The regional annual average growth rate (AAGR) is predicted at over 3% from 2025 to 2028, aided by investments from the public and private sectors to build industrial and energy projects. Among these, energy construction projects are expected to pick up momentum owing to the intensive efforts by the regional governments to form clean energy projects. For example, the government of Turkey in January 2023 announced its hydrogen strategy which involves producing hydrogen at $2.40/kg by 2035 using solar energy. Thus, the domestic government is aggressively supporting solar PV energy through auctions and feed-in-tariffs.
Similarly, the regional development of the industrial construction sector is set to be aided by the establishment of new manufacturing plants over the forecast period. For instance, in February 2024, Lithuania-based technology company Teltonika announced its plans to develop a semiconductor manufacturing facility in Vilnius. The company has entered into a strategic partnership with Taiwan’s Industrial Technology Research Institute (ITRI) includes a license to manufacture ITRI’s semiconductor chips and devices.
Over the forecast period, further development in the regional construction sector is set to be aided by the extension of infrastructure projects including railways, highways, ports, and airports. For example, the development of an 870 km long high-speed rail project in the Baltic region is set to connect the capitals of Latvia, Lithuania, and Estonia, with Poland and the rest of the European region. The project is due to be completed in 2030 and has a total project cost of over $5.9 billion.
| Market Size (2023) | $809.2 billion |
| CAGR (2024 – 2028) | >3% |
| Forecast Period | 2024-2028 |
| Historic Data | 2019-2023 |
| Report Scope & Coverage | Sector Overview, Construction Output Value ($Million) by Country and Sector, Top Project List, Key Industry Participants |
| Key Sectors | Commercial Construction, Energy and Utilities Construction, Industrial Construction, Infrastructure Construction, Institutional Construction, and Residential Construction |
| Geography | Eastern Europe |
| Countries | Azerbaijan, Belarus, Bulgaria, Croatia, Czech Republic, Estonia, Hungary, Kazakhstan, Latvia, Lithuania, Poland, Romania, Russia, Slovakia, Slovenia, Turkey, Ukraine, and Uzbekistan |
| Enquire & Decide | Discover the perfect solution for your business needs. Enquire now and let us help you make an informed decision before making a purchase. |
Eastern Europe Construction Market Segmentation by Sectors
The residential construction segment is expected to register a negative trajectory in 2024, the market dynamics are predicted to rebound by 2025, supported by the regional government’s efforts to boost the uptake of housing units. For example, in January 2024, the government of Poland launched a scheme named Flat for a Start which aims to assist individuals buying their first residential unit. This initiative proposes a 1.5% loan subsidy for one and two-person households, 1% for three-individual households, and 0.5% subsidy for four-person households.
The infrastructure construction group is set to emerge as the second-largest category in 2024. This segment is set to register an annual average growth rate of nearly 4% from 2025 to 2028, supported by the ongoing and upcoming airport projects. For example, the Istanbul airport in Turkey was opened in 2018, the project is undergoing further development with a targeted investment of over $697 million for 2024. This investment includes construction work for runways and terminals along with the solar power project. The domestic airport authority aims to attract 85 million passengers and has targeted 532,000 flights for this year.
Eastern Europe Construction Market Share by Sectors, 2024 (%)
Buy the Full Report for More Information on Eastern Europe Construction Market Sectors
The energy and utilities construction category is set to register the fastest compound annual growth rate (CAGR) of above 3% over the forecast period. This growth is set to be aided by the regional government’s effort to diversify the energy mix by building new renewable energy projects. For example, the government of the Czech Republic revised its National Energy and Climate Plan (NCEP) in October 2023. The modified plan aims to build 6,000 MW of solar plants including construction work of a substation and installation of PV panels, turbines, generators, and transmission lines by 2030. Similarly, in March 2024, the European Investment Bank (EIB) approved the funding of over $111 million for the expansion work of the Kruonis Pumped Storage Hydroelectric Power Plant in Lithuania. The expansion work includes increasing plant capacity to 1 GW by 2026 from 900 MW in 2023.
The commercial construction segment is set to emerge as the fourth-largest sector in 2024. However, segmental dynamics are expected to record a negative trajectory in terms of output value (Real) during this current year. This decline in growth is partially driven by the high inflation and interest rates. However, the segmental output value (Real) is anticipated to rebound by 2025, supported by investments in the regional hospitality sector. For example, in Nigeria-based hotel group plans to invest $69 million to construct a five-star hotel with 237 room capacity in Turkey.
The industrial construction group is predicted to register a lucrative annual average growth rate (AAGR) of over 4.0% from 2025 to 2028. This growth over the forecast period is set to be driven by the rising foreign direct investments in the regional countries. For instance, as per the data released by the Investment and Development Agency of Latvia (LIAA), the foreign direct investment volume in the country rose by 30% in 2023 as compared to the previous year. The data further revealed that 46 projects were implemented in 2023 with more than half of the projects located in Riga and Pieriga.
The institutional construction category is expected to register the smallest share of nearly 4% in 2024. The segmental growth is primarily aided by investments in the healthcare and education industries. For example, the government of Russia is set to undertake construction work for the Sirius Science and Technology campus in Krasnodar with a total project cost of approximately $639 million. The construction work is predicted to commence by the end of 2024 and is set to be completed by 2030.
Eastern Europe Construction Market Analysis by Country
Russia is likely to continue its dominance over the forecast period. The growth is set to be driven by the investments from the government in heavy infrastructure. For example, the government aims to spend over $51 billion in improving the domestic public infrastructure and another $2.8 billion in strengthening the airport infrastructure in the country.
Poland is anticipated to emerge as the second-largest country in terms of construction output value (Real) in 2024. The domestic construction sector dynamics are likely to remain weak this year and are expected to continue till next year. The subdued consumer and investor confidence amid high construction costs and interest rates. However, this scenario is projected to change by 2026, supported by investments in transport, renewable energy, and industrial segments.
Eastern Europe Construction Market Share by Country, 2024 (%)
Buy the Full Report for Regional Insights into the Eastern Europe Construction Market
Turkey is expected to account for a revenue share of over 14% in terms of construction output value (Real) in 2024. The country’s growth in the coming two to three years is set to be aided by the reconstruction of residential buildings destroyed during the earthquakes of 2023. For example, the Turkish government’s plan of $36 billion aims to build 500,000 housing units and provide 250,000 land plots for residential purposes. This plan is set to be implemented across 81 provinces from 2023 to 2028. The first phase of the plan is due to be completed by the end of 2024 with construction work on 50,000 housing units in Istanbul and 40,500 residential units in the cities of Ankara, Izmir, and Gaziantep.
The fourth largest country in the Eastern Europe regional mix is the Czech Republic in 2024. The growth over the projected timeframe is expected to be supported by the development of local transport infrastructure. For example, in October 2023, the domestic Finance Ministry approved the allocation of nearly $1.3 billion to expand Prague’s airport. The expansion work includes an extension of the terminal 2 building along with 3,500 automotive parking spaces, 54,000 square feet of retail, and over 86,000 square feet of lounge section.
Eastern Europe Construction Market Segments
GlobalData Plc has segmented the Eastern Europe construction market report by sectors and country:
Eastern Europe Construction Market Sectors Outlook (Revenue, $Million, 2019-2028)
- Commercial Construction
- Energy and Utilities Construction
- Industrial Construction
- Infrastructure Construction
- Institutional Construction
- Residential Construction
Eastern Europe Construction Market Countries Outlook (Revenue, $Million, 2019-2028)
- Azerbaijan
- Belarus
- Bulgaria
- Croatia
- Czech Republic
- Estonia
- Hungary
- Kazakhstan
- Latvia
- Lithuania
- Poland
- Romania
- Russia
- Slovakia
- Slovenia
- Turkey
- Ukraine
- Uzbekistan
Scope
The market intelligence report provides an in-depth analysis of the following –
- Eastern European construction market outlook: analysis as well as historical figures and forecasts of opportunities from the sector and regional segments.
- The report provides an overview of the outlook for the Eastern European construction industry to 2028.
- Analysis of the construction output values (Real) in major countries: Azerbaijan, Belarus, Bulgaria, Croatia, Czech Republic, Estonia, Hungary, Kazakhstan, Latvia, Lithuania, Poland, Romania, Russia, Slovakia, Slovenia, Turkey, Ukraine, Uzbekistan.
- Insight into the sectoral movement covering commercial construction, energy and utilities construction, industrial construction, infrastructure construction, institutional construction, and residential construction.
- Dedicated section covering key industry participants by country including top consultants and contractors.
Key Highlights
The Eastern Europe construction market size will be evaluated at $809.2 billion in 2024. The construction market in the Eastern Europe region is expected to grow at a CAGR of 3.6% during 2024-2028.
Reasons to Buy
• Evaluate regional trends in construction development from insight into output values and project pipelines. Identify the fastest growers to enable assessment and targeting of commercial opportunities in the markets best suited to strategic focus.
• Identify the drivers in the Eastern European construction market and consider growth in developed economies. Formulate plans on where and how to engage with the market while minimizing any negative impact on revenues.
• Accompanying GlobalData’s Forecast products, the report examines the assumptions and drivers behind ongoing and upcoming trends in the Eastern European construction market.
Key Players
Table of Contents
Table
Figures
Frequently asked questions
-
What will be the Eastern Europe construction market size in 2024?
The Eastern Europe construction market size is expected to be valued at $809.2 billion in 2024.
-
What is the Eastern Europe construction market growth rate?
The Eastern Europe construction market is expected to grow at a CAGR of more than 3% during the forecast period.
-
What is the key Eastern Europe construction market driver?
The Eastern Europe construction market growth is primarily driven by increasing spending in the infrastructure and energy sectors.
-
Which will be the leading sector in the Eastern Europe construction market in 2024?
The residential construction category is predicted to account for the largest Eastern European construction market share in 2024.
-
Is there a third level of segmentation in the report?
GlobalData’s focus is on providing reliable and accurate data that is supported by robust research methodology. Our reports undergo rigorous quality checks and are based on primary and secondary research sources, ensuring that the numbers and insights provided are trustworthy. However, despite the best efforts to gather comprehensive data, there could be instances where the available data is limited, making it challenging to provide third-level segmentation. In such cases, GlobalData may choose to provide high-level insights and general trends rather than forcing segmentation that may not be backed by sufficient data. This approach ensures that the report’s overall quality and credibility are maintained.
Get in touch to find out about multi-purchase discounts
reportstore@globaldata.com
Tel +44 20 7947 2745
Every customer’s requirement is unique. With over 220,000 construction projects tracked, we can create a tailored dataset for you based on the types of projects you are looking for. Please get in touch with your specific requirements and we can send you a quote.
Sample Report
We are confident about Eastern Europe Construction Market Size, Share, Trends, and Analysis by Sector, Country, and Segment Forecasts to 2028 report's unique quality. However, we want you to make the most beneficial decision for your business, so we offer free sample pages to help you:
- Assess the relevance of the report
- Evaluate the quality of the report
- Justify the cost
Download your copy of the sample report and make an informed decision about whether the full report will provide you with the insights and information you need.


Related reports
View more Construction reports

