Electric Vehicle (EV) Charging Infrastructure Market Size, Trends and Analysis by Region, Level, Power and Segment Forecast to 2030

Powered by

Access in-depth insight and stay ahead of the market

Accessing the in-depth insights from the ‘Electric Vehicle Charging Infrastructure’ report can help:

  • In evaluating volume data and revenue generated by the public electric vehicle charging points installed across different regions and countries.
  • Detailed mapping of the entire value chain ecosystem and its associated stages.
  • In-depth viewing of key supporting regulatory policies influencing the deployment of EV charging infrastructure.
  • Finding potential growth opportunities in terms of volume (unit) and revenue ($Million).
  • Foreseeing the shifting landscape of the automotive sector towards electric vehicles and its supporting infrastructure.
  • Gaining insights on technological trends and the recent developments.
  • Analyzing key factors or variables aiding the adoption of EV charging infrastructure.

How is our ‘Electric Vehicle Charging Infrastructure’ report different from other reports in the market?

  • The report explores the data on installed public electric vehicle charging station points in terms of volume and value across different regions and countries.
  • The study entails a summarization of key factors or variables responsible for assisting market growth during the forecast period.
  • Detailed segmentation by power– Less than 1.8 kW, 1.9 kW-7.8 kW, 7.9 kW-25 kW, 26 kW-100 kW, and More than 100 kW
  • Detailed segmentation by level– Level 1, Level 2, and DC Chargers
  • With more than 150+ charts, the report is designed with an easy digestible qualitative content.
  • The study presents intelligence around recent mergers & acquisitions, filed patents, and social media analytics.
  • Analysis of the battery raw material supply case and its evolving demand
  • The key market participants operating within this market and their respective profiles are laid out with dedicated sections on company overview, financials, products & services, strategic initiatives, and key personnel.

We recommend this valuable source of information to professionals involved in:

  • Automotive Manufacturing
  • Electric Vehicle Manufacturing
  • EV Charging Equipment Manufacturing
  • EV Charging Component Manufacturing
  • Regulations and Policy Making
  • Independent Research
  • BI analysts
  • Venture Funding

Buy the Full Report to Get a Snapshot of the Electric Vehicle Charging Infrastructure Market, Download a Free Report Sample

Electric Vehicle (EV) Charging Infrastructure Market Report Overview

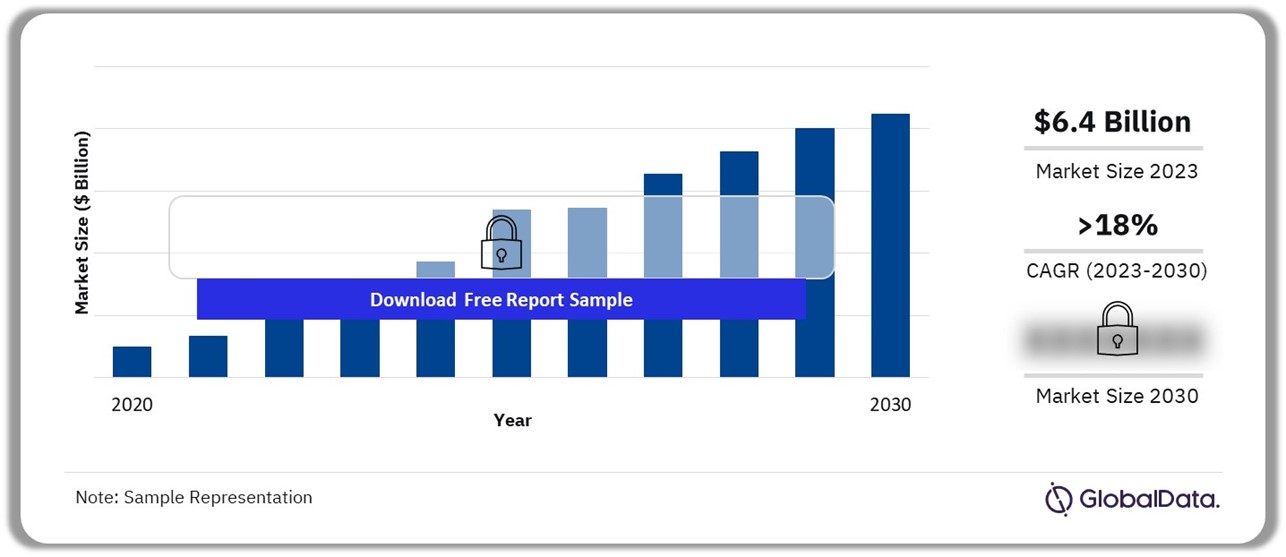
The electric vehicle charging infrastructure market size revenue was valued at $6.4 billion in 2023 and is expected to grow at a compound annual growth rate (CAGR) of more than 18% over the forecast period. Surging collaboration between automakers, charging infrastructure providers, and increasing governments promotions toward the development of common standards for connectors, communication protocols, and payment systems is anticipated to drive the market growth significantly over the forecast period.

Interoperability is crucial for the uptake of EVs and in promoting compatibility among different electric automotive vehicles. This has prompted various stakeholders to collaborate and establish standards in the market. For instance, in February 2023, the US Federal Highway Administration announced new national standards for public electric vehicle chargers to ensure compatibility, accessibility, consistency, and reliability. As a result of the new standards, Tesla announced it will open a portion of its US Supercharger and Destination Charger network to non-Tesla EVs.

Electric Vehicle Charging Infrastructure Market Outlook, 2020-2030 ($ Billion)

Electric Vehicle Charging Infrastructure Market Outlook, 2020-2030 ($ Billion)

Buy the Full Report for Additional Insights on the Electric Vehicle Charging Infrastructure Market Forecast

Download a Free Report Sample

The charging station deployment in terms of volume observed a steady growth in the post-pandemic era fueled by a continuous rise in electric vehicle sales. For instance, as per the data released by the International Energy Agency (IEA) in July 2023, the share of electric cars sold has increased from 4% to 14% from 2020 to 2022. In the US alone, the sales volume jumped from 0.3 million units in 2020 to 1.6 million in 2023.

In January 2024, the US federal government announced a grant of $623 million to develop charging networks for electric vehicles across the country. This plan also aims to build 500,000 affordable and reliable public charging stations by 2030, thus ensuring a strong boost to the local EV industry and its associated sectors.

Similarly, in March 2023, the government of India announced a subsidy of $95 million to set up 7,432 charging points across the country. This subsidy is directed towards state-run oil marketing companies that already possess a strong existing network of fuel charging stations across the country. In addition, the offered subsidy is only for CCS chargers that offer a voltage of above 300 volts. Since EV adoption in India is still at a nascent stage, the government is refraining from mandating specific protocols around interoperability.

Market Size (2023) $6.4 billion
CAGR 18.5% from 2023 to 2030
Forecast Period 2023-2030
Historic Data 2020-2022
Report Scope & Coverage Industry Overview, Volume and Revenue Forecast, Regional Analysis, Company Profiles, Growth Trends
Power Segment Less than 1.8 kW, 1.9 kW-7.8 kW, 7.9 kW-25 kW, 26 kW-100 kW, and More than 100 kW
Level Segment Level 1, Level 2, and DC Chargers
Geography North America, Europe, Asia Pacific, South & Central America, and Middle East & Africa
Countries US, Canada, Mexico, France, Germany, Italy, Netherlands, Norway, Sweden, UK, Turkey, China, India, Korea, Brazil, Chile, and South Africa
Key Companies ABB Ltd., AeroVironment Inc., BYD Co Ltd., ChargePoint Holdings Inc., Eaton Corporation Plc., General Electric Co., Schneider Electric SE, Shell Plc., Siemens AG, Tesla Inc.
Enquire & Decide Discover the perfect solution for your business needs. Enquire now and let us help you make an informed decision before making a purchase.

Electric Vehicle Charging Infrastructure Market Segmentation by Power Type

The power type segment encompasses five different categories, among which in terms of value, the more than 100 kW group commanded a dominating share in 2023. This category of chargers is widely preferred for commercial usage owing to the higher power output as compared to its counterparts. In addition, this category is also witnessing rapid development in terms of technology upgradation and thus, is anticipated to remain a dominating group, providing hassle-free charging using wireless mechanism.

For instance, in March 2024, researchers at Oak Ridge National Laboratory (ORNL) in the US successfully demonstrated 100 kW wireless charging of an electric vehicle. The process was completed at a five-inch distance between the vehicle and the charger. The demonstration was carried out on the Hyundai Kona EV with an astonishing 96% efficiency rate. In addition, this technology provides power densities 8 to 10 times higher than the conventional coil technology as per the testing results carried out by ORNL scientists.

The next largest category is the 26 kW to 100 kW group which registered a revenue share of over 21% in 2023. This segment is poised to grow at a steady rate supported by developments in the field of DC-to-DC charging systems. For instance, in February 2023, the US-based company, Enteligent, unveiled the world’s first solar DC-to-DC charging hybrid bidirectional charging system.

Electric Vehicle Charging Infrastructure Market Analysis by Power, 2023 (%)

Electric Vehicle Charging Infrastructure Market Analysis by Power, 2023 (%)

Buy the Full Report for More Segment-Wise Information on Electric Vehicle Charging Infrastructure Market, Download a Free Report Sample

The other remaining power segments together in terms of value registered a single-digit revenue share in 2023. Despite the low revenue share, the 7.9 kW to 25 kW category is expected to register the fastest compounded annual growth rate (CAGR) of 18.9% over the forecast period, aided by the peaking consumer interest for a fast charger at an economical price. However, in terms of volume 1.9 kW to 7.8 kW group accounted for the highest share in 2023 owing to its low pricing and moderate speed.

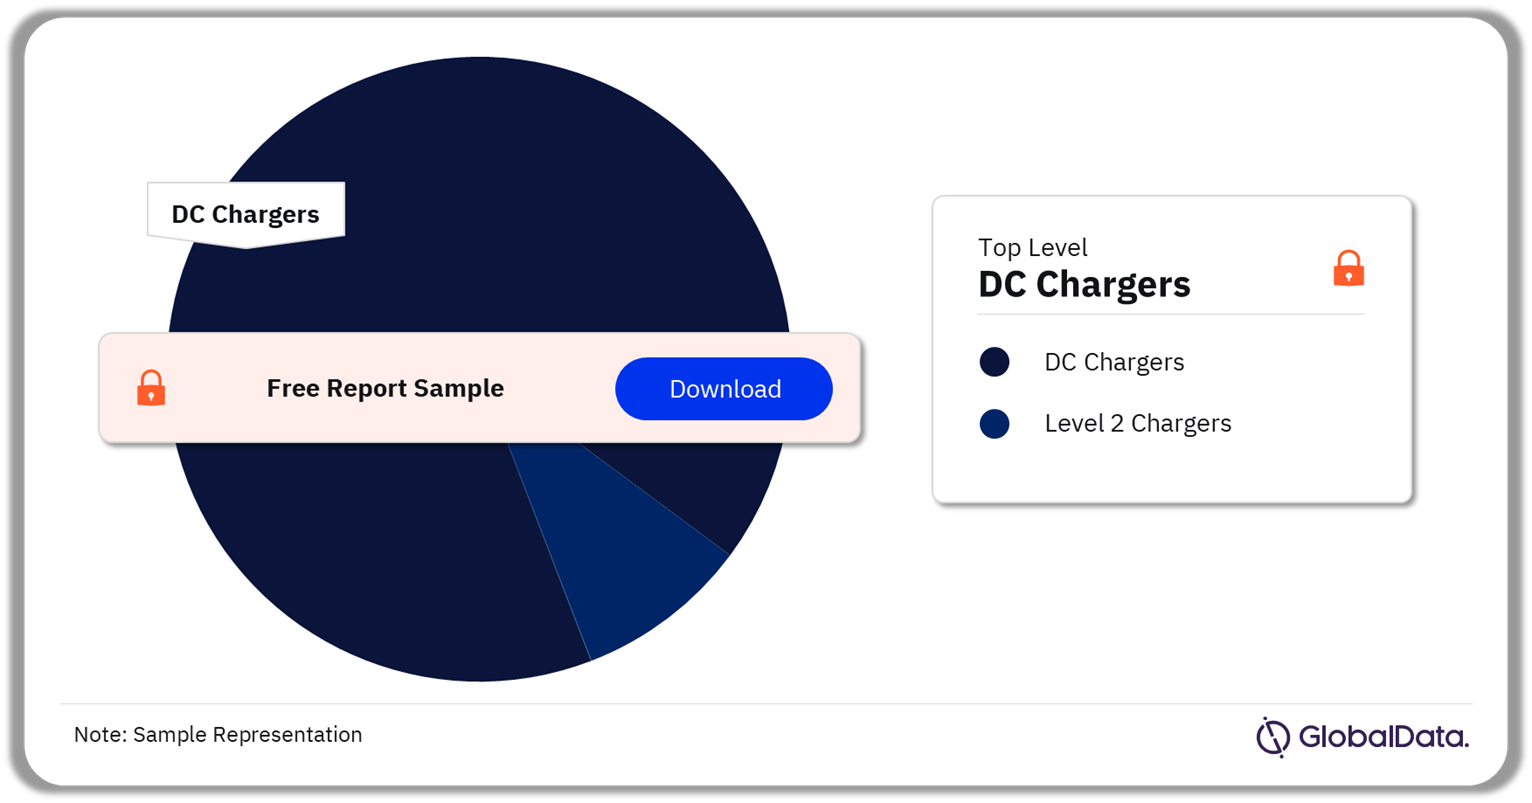
Electric Vehicle Charging Infrastructure Market Segmentation by Level

The Level 1 chargers accounted for the smallest revenue market share in 2023 owing to their economic value. In addition, these types of chargers are more suitable for smaller battery capacities and are primarily employed to charge electric vehicles at home. Despite its lower penetration, the growth in this charger segment remained steady in the previous year aided by the installations at transportation terminals. For instance, in Q3 of 2023, the Level 1 chargers demonstrated the highest growth of 15.5% in the US as per the data released by the National Renewable Energy Laboratory (NREL). This included the installation of 132 Level 1 charging points at Washington and California airports.

The next category of Level 2 chargers observed a year-on-year (YoY) growth rate of over 31% in terms of value in 2023. This growth was primarily driven by the launch of residential purpose level 2 chargers. For example, in August 2023, Tesla launched its universal level 2 charger for residential usage with NACS and J1772 plugs. Similarly, in November 2023, DeWalt unveiled its residential level 2 charger to meet the growing demand in the domestic market.

Electric Vehicle Charging Infrastructure Market Share by Level, 2023 (%)

Electric Vehicle Charging Infrastructure Market Share by Level, 2023 (%)

Buy the Full Report for More Information on Electric Vehicle Charging Infrastructure Market Level
Download a Free Report Sample

The third category of DC chargers, being the fastest compared as compared to its counterparts, dominated the overall market in terms of value in 2023. This category of chargers is mostly employed at commercial sites offering swift charging ability in the range of 20 minutes to one hour. This segment is also poised to demonstrate the fastest-compounded annual growth rate (CAGR) of more than 19% in terms of value over the forecast period. In January 2024, EVIQ unveiled the fast-charging site in Riyadh powered by two DC chargers allowing it to serve four electric vehicles simultaneously. The rising number of such projects will ensure segmental growth during the forecast period.

Electric Vehicle Charging Infrastructure Market Analysis by Region

Europe captured the largest regional share in terms of value in 2023, aided by the expansion in electric vehicle sales. As per the statistics released by the European Automobile Manufacturers’ Association, the sales volume of the battery-EVs surged by 37% in 2023 as compared to the previous year. This rise in sales of EVs directly assisted the development of charging station points in the region during 2023. As per the data from the European Alternative Fuel Observatory (EAFO), the public charging points in the European Union alone reached 630,000 by the end of 2023. For future growth, Germany has already marked $983 million in subsidies to expand the number of charging stations in the country. Thus, government-based incentives coupled with the rising sales volume of electric vehicles are set to aid regional growth over the projected timeframe.

Asia Pacific emerged as the second-largest region in terms of value in 2023. The regional growth is primarily driven by China which is among the largest markets for EVs in the world. The China EV industry flourished in recent years with an integrated approach from raw material processing to battery manufacturing. The country observed the highest number of electric vehicle sales in 2022 and 2023. As per the China Passenger Car Association, the shipment of EVs and hybrid vehicles to local dealers is set to reach 11 million units, representing a year-on-year increase of 25% in 2024, a trend that will boost the market growth in the forecast period.

Electric Vehicle Charging Infrastructure Market Share by Region, 2023 (%)

Electric Vehicle Charging Infrastructure Market Share by Region, 2023 (%)

Buy the Full Report for Regional Insights into the Electric Vehicle Charging Infrastructure Market
Download a Free Report Sample

The charging infrastructure of EVs in North America accounted for a global revenue share of over 23% in 2023. The regional dynamics are primarily influenced by the development of the US electric vehicle sector. The US accounted for over 91% of the regional share in 2023, supported by government incentives and subsidies. Notably, the Bipartisan Infrastructure Law aims to invest $7.5 billion to develop high-speed charging stations every 50 miles across the country’s major interstates and freeways. This government-based interest in uplifting the domestic infrastructure for electric vehicles is set to aid the market growth over the forecast period.

The regions of South & Central America and Middle East & Africa in terms of value accounted for a minuscule share as compared to their counterparts in 2023. However, both regions are set to register a high compounded annual growth rate as compared to the other regions over the projected timeframe, aided by efforts to boost electric vehicle adoption and related infrastructure. For instance, Brazil is anticipated to have 10 thousand public and semi-public electric charging points by 2025 as per the estimation made in the 3rd Electric Mobility Yearbook from Plataforma Nacional de Mobilidade Elétrica (PNME).

Electric Vehicle Charging Infrastructure Market – Competitive Landscape

The competitive landscape of the electric vehicle charging infrastructure industry is gradually shifting towards consolidation, especially in the maturing markets of Europe. For instance, in February 2023, Shell announced the acquisition of evpass, which has the largest network of charging stations in Switzerland. This acquisition aligns with Shell’s objective to operate 2.5 million charging stations worldwide by 2030.

On the other hand, the capital raising activities through equity financing and loan deals are accelerating in 2024. For example, in January 2024, the European Investment Bank (EIB) permitted a $43 million loan to Eldrive to expand the charging station network across Bulgaria, Romania, and Lithuania.

Similarly, in January 2024, Powerdot secured $107 million in capital to expand its coverage across the European region. The company already has a strong presence across four European countries including France, Poland, Spain, and Portugal.

Leading Companies in the Electric Vehicle Charging Infrastructure Market

  • ABB Ltd.
  • AeroVironment Inc.
  • BYD Co Ltd.
  • ChargePoint Holdings Inc.
  • Eaton Corporation Plc
  • General Electric Co.
  • Schneider Electric SE
  • Shell Plc
  • Siemens AG
  • Tesla Inc.

Other Electric Vehicle Charging Infrastructure Market Vendors Mentioned

RWE, EVBox, EnBW, Vattenfall, Bosch, Innogy, Enel, BP, EVgo, Teld New Energy, Electricity Highway, Pod Point, Park & Charge, Blink, Star Charge, Ecotricity, EV Connect, Ionity, and Engie, among others.

Leading Electric Vehicle Charging Infrastructure Market Players

Leading Electric Vehicle Charging Infrastructure Market Players

Buy the Full Report to Know More About Leading Electric Vehicle Charging Infrastructure Companies
Download a Free Report Sample

Electric Vehicle Charging Infrastructure Market Segments

GlobalData Plc has segmented the electric vehicle charging infrastructure market report by power, level, and region:

Electric Vehicle Charging Infrastructure Market Power Outlook (Revenue, $Million; Volume, Units 2020-2030)

  • Less than 1.8 kW
  • 9 kW to 7.8 kW
  • 9 kW to 25 kW
  • 26 kW to 100 kW
  • More than 100 kW

Electric Vehicle Charging Infrastructure Market Level Outlook (Revenue, $Million; Volume, Units 2020-2030)

  • Level 1 Chargers
  • Level 2 Chargers
  • DC Chargers

Electric Vehicle Charging Infrastructure Market Regional Outlook (Revenue, $Million; Volume, Units 2020-2030)

  • North America
    • US
    • Canada
    • Mexico
  • Europe
    • France
    • Germany
    • Italy
    • The Netherlands
    • Norway
    • Sweden
    • The UK
    • Turkey
    • Rest of Europe
  • Asia Pacific
    • China
    • India
    • South Korea
    • Rest of Asia Pacific
  • South & Central America
    • Brazil
    • Chile
  • Middle East & Africa
    • South Africa

Key Highlights

The EV charging infrastructure market will be valued at $ 6.4 billion in 2023 and is expected to grow at a CAGR of 18.5% over the forecast period (2023-2030). The EV charging infrastructure market report provides an executive-level overview of the electric vehicle charging infrastructure industry worldwide today, with detailed forecasts of key indicators up to 2030.

Table of Contents

  • Chapter 1 Executive Summary
  • Chapter 2 Research Scope & Segmentation
  • Chapter 3 Market Overview
  • Chapter 4 EV Charging Infrastructure – Industry Trend Analysis

    • 4.1. Electric Vehicle Industry Value Chain Analysis
    • 4.2. EV Charging Infrastructure Market Value Chain Analysis
    • 4.3. EV Charging Infrastructure – Market Drivers
    • 4.4. EV Charging Infrastructure – Market Challenges
    • 4.5. Technological Trends
    • 4.6. Regulatory Trends
    • 4.7. Electric Vehicle Sector – M&A Activity Dashboard 2019-2023
    • 4.8. Electric Vehicle Sector – Venture Financing Activity Dashboard 2019-2023
    • 4.9. Electric Vehicle Sector – Job Analytics Dashboard 2022
    • 4.10. Electric Vehicle Sector – Social Media Analytics Dashboard 2019-2023

  • Chapter 5 EV Charging Infrastructure- Segment Outlook

  • 5.1. EV Charging Infrastructure Market – Revenue & Volume Snapshot
  • 5.2. EV Charging Infrastructure Market – By Region
  • 5.3. EV Charging Infrastructure Market – By Power
  • 5.4. EV Charging Infrastructure Market – By Level
  • Chapter 6 EV Charging Infrastructure – Regional Outlook

  • 6.1. EV Charging Infrastructure Market – Regional Deep Dive
  • 6.2. North America

    • 6.2.1. North America EV Charging Infrastructure Market Estimates & Forecasts, By Power 2020-2030 ($Million; Units)
    • 6.2.2. North America EV Charging Infrastructure Market Estimates & Forecasts, By Level 2020-2030 ($Million; Units)
    • 6.2.3. US

      • 6.2.3.1. US EV Charging Infrastructure Market Estimates & Forecasts, By Power 2020-2030 ($Million; Units)
      • 6.2.3.2. US EV Charging Infrastructure Market Estimates & Forecasts, By Level 2020-2030 ($Million; Units)

    • 6.2.4. Canada

      • 6.2.4.1. Canada EV Charging Infrastructure Market Estimates & Forecasts, By Power 2020-2030 ($Million; Units)
      • 6.2.4.2. Canada EV Charging Infrastructure Market Estimates & Forecasts, By Level 2020-2030 ($Million; Units)

    • 6.2.5. Mexico

      • 6.2.5.1. Mexico EV Charging Infrastructure Market Estimates & Forecasts, By Power 2020-2030 ($Million; Units)
      • 6.2.5.2. Mexico EV Charging Infrastructure Market Estimates & Forecasts, By Level 2020-2030 ($Million; Units)

  • 6.3. Europe

    • 6.3.1. Europe EV Charging Infrastructure Market Estimates & Forecasts, By Power 2020-2030 ($Million; Units)
    • 6.3.2. Europe EV Charging Infrastructure Market Estimates & Forecasts, By Level 2020-2030 ($Million; Units)
    • 6.3.3. France

      • 6.3.3.1. France EV Charging Infrastructure Market Estimates & Forecasts, By Power 2020-2030 ($Million; Units)
      • 6.3.3.2. France EV Charging Infrastructure Market Estimates & Forecasts, By Level 2020-2030 ($Million; Units)

    • 6.3.4. Germany

      • 6.3.4.1. Germany EV Charging Infrastructure Market Estimates & Forecasts, By Power 2020-2030 ($Million; Units)
      • 6.3.4.2. Germany EV Charging Infrastructure Market Estimates & Forecasts, By Level 2020-2030 ($Million; Units)

    • 6.3.5. Italy

      • 6.3.5.1. Italy EV Charging Infrastructure Market Estimates & Forecasts, By Power 2020-2030 ($Million; Units)
      • 6.3.5.2. Italy EV Charging Infrastructure Market Estimates & Forecasts, By Level 2020-2030 ($Million; Units)

    • 6.3.6. Netherlands

      • 6.3.6.1. Netherlands EV Charging Infrastructure Market Estimates & Forecasts, By Power 2020-2030 ($Million; Units)
      • 6.3.6.2. Netherlands EV Charging Infrastructure Market Estimates & Forecasts, By Level 2020-2030 ($Million; Units)

    • 6.3.7. Norway

      • 6.3.7.1. Norway EV Charging Infrastructure Market Estimates & Forecasts, By Power 2020-2030 ($Million; Units)
      • 6.3.7.2. France EV Charging Infrastructure Market Estimates & Forecasts, By Level 2020-Norway2030 ($Million; Units)

    • 6.3.8. Sweden

      • 6.3.8.1. Sweden EV Charging Infrastructure Market Estimates & Forecasts, By Power 2020-2030 ($Million; Units)
      • 6.3.8.2. Sweden EV Charging Infrastructure Market Estimates & Forecasts, By Level 2020-2030 ($Million; Units)

    • 6.3.9. UK

      • 6.3.9.1. UK EV Charging Infrastructure Market Estimates & Forecasts, By Power 2020-2030 ($Million; Units)
      • 6.3.9.2. France EV Charging Infrastructure Market Estimates & Forecasts, By Level 2020-2030 ($Million; Units)

    • 6.3.10. Turkey

      • 6.3.10.1. Turkey EV Charging Infrastructure Market Estimates & Forecasts, By Power 2020-2030 ($Million; Units)
      • 6.3.10.2. Turkey EV Charging Infrastructure Market Estimates & Forecasts, By Level 2020-2030 ($Million; Units)

    • 6.3.11. Rest of Europe

      • 6.3.11.1. Rest of Europe EV Charging Infrastructure Market Estimates & Forecasts, By Power 2020-2030 ($Million; Units)
      • 6.3.11.2. Rest of Europe EV Charging Infrastructure Market Estimates & Forecasts, By Level 2020-2030 ($Million; Units)

  • 6.4. Asia Pacific

    • 6.4.1. Asia Pacific EV Charging Infrastructure Market Estimates & Forecasts, By Power 2020-2030 ($Million; Units)
    • 6.4.2. Asia Pacific EV Charging Infrastructure Market Estimates & Forecasts, By Level 2020-2030 ($Million; Units)
    • 6.4.3. China

      • 6.4.3.1. China EV Charging Infrastructure Market Estimates & Forecasts, By Power 2020-2030 ($Million; Units)
      • 6.4.3.2. China EV Charging Infrastructure Market Estimates & Forecasts, By Level 2020-2030 ($Million; Units)

    • 6.4.4. India

      • 6.4.4.1. India EV Charging Infrastructure Market Estimates & Forecasts, By Power 2020-2030 ($Million; Units)
      • 6.4.4.2. India EV Charging Infrastructure Market Estimates & Forecasts, By Level 2020-2030 ($Million; Units)

    • 6.4.5. South Korea

      • 6.4.5.1. South Korea EV Charging Infrastructure Market Estimates & Forecasts, By Power 2020-2030 ($Million; Units)
      • 6.4.5.2. South Korea EV Charging Infrastructure Market Estimates & Forecasts, By Level 2020-2030 ($Million; Units)

    • 6.4.6. Rest of Asia Pacific

      • 6.4.6.1. Rest of Asia Pacific EV Charging Infrastructure Market Estimates & Forecasts, By Power 2020-2030 ($Million; Units)
      • 6.4.6.2. Rest of Asia Pacific EV Charging Infrastructure Market Estimates & Forecasts, By Level 2020-2030 ($Million; Units)

  • 6.5. South & Central America

    • 6.5.1. South & Central America EV Charging Infrastructure Market Estimates & Forecasts, By Power 2020-2030 ($Million; Units)
    • 6.5.2. South & Central America EV Charging Infrastructure Market Estimates & Forecasts, By Level 2020-2030 ($Million; Units)
    • 6.5.3. Brazil

      • 6.5.3.1. Brazil EV Charging Infrastructure Market Estimates & Forecasts, By Power 2020-2030 ($Million; Units)
      • 6.5.3.2. Brazil EV Charging Infrastructure Market Estimates & Forecasts, By Level 2020-2030 ($Million; Units)

    • 6.5.4. Chile

      • 6.5.4.1. Chile EV Charging Infrastructure Market Estimates & Forecasts, By Power 2020-2030 ($Million; Units)
      • 6.5.4.2. Chile EV Charging Infrastructure Market Estimates & Forecasts, By Level 2020-2030 ($Million; Units)

  • 6.6. Middle East & Africa

    • 6.6.1. Middle East & Africa EV Charging Infrastructure Market Estimates & Forecasts, By Power 2020-2030 ($Million; Units)
    • 6.6.2. Middle East & Africa EV Charging Infrastructure Market Estimates & Forecasts, By Level 2020-2030 ($Million; Units)
    • 6.6.3. South Africa

      • 6.6.3.1. South Africa EV Charging Infrastructure Market Estimates & Forecasts, By Power 2020-2030 ($Million; Units)
      • 6.6.3.2. South Africa EV Charging Infrastructure Market Estimates & Forecasts, By Level 2020-2030 ($Million; Units)

  • Chapter 7 EV Charging Infrastructure – Company Profiles

  • 7.1. ABB Ltd.
  • 7.2. AeroVironment Inc.
  • 7.3. BYD Co Ltd.
  • 7.4. ChargePoint Holdings Inc.
  • 7.5. Eaton Corporation Plc
  • 7.6. General Electric Co.
  • 7.7. Schneider Electric SE
  • 7.8. Shell plc
  • 7.9. Siemens AG
  • 7.10. Tesla Inc.
  • Chapter 8 Research Methodology

  • 8.1. Research Methodology Steps

    • 8.1.1. Market Study
    • 8.1.2. Research
    • 8.1.3. Analysis
    • 8.1.4. Quality Control

  • Chapter 9 About GlobalData

Figures

  • Fig 1 Top EV Charging Infrastructure Country Markets, 2022 Vs 2030
  • Fig 2 Market Snapshot
  • Fig 3 EV Charging Infrastructure CAGR by Power, 2023-2030
  • Fig 4 List of Key Companies Across Value Chain Layers
  • Fig 5 EV Charging Networks Prevalent in Key Countries
  • Fig 6 EV Charging Infrastructure Market – Segmentation
  • Fig 7 Illustration of EV Charging Infrastructure
  • Fig 8 Electric Vehicle – Industry Value Chain Analysis
  • Fig 9 EV Charging Infrastructure – Industry Value Chain Analysis
  • Fig 10 Deal Volume: Global Electric Vehicle M&A Deals
  • Fig 11 Deal Value ($M): Global Electric Vehicle M&A Deals
  • Fig 12 Geographical Distribution: Electric Vehicle Deals Volume & Value Share (2019-2023)
  • Fig 13 Leading Advisors of Electric Vehicle-Related Companies
  • Fig 14 Deal Volume: Electric Vehicle M&A Deals by Related Sector
  • Fig 15 Deal Volume: Global Electric Vehicle VF Deals
  • Fig 16 Deal Value ($M): Global Electric Vehicle VF Deals
  • Fig 17 Geographical Distribution: Electric Vehicle Deals Volume & Value Share (2019-2023)
  • Fig 18 Active Jobs: Electric Vehicle Jobs Across all Sectors in 2022
  • Fig 19 Active Jobs: Electric Vehicle Jobs by Related Themes in 2022
  • Fig 20 Geographical Distribution: Electric Vehicle Active Jobs
  • Fig 21 Leading Companies with Electric Vehicle Active Jobs in 2022
  • Fig 22 Electric Vehicle: Active Jobs-Related Themes in 2022
  • Fig 23 Total Number of Social Media Posts on Electric Vehicles
  • Fig 24 Top Hashtags around Electric Vehicles on Social Media
  • Fig 25 Top Electric Vehicle Influencers on Social Media
  • Fig 26 Geographies Mentioned with Electric Vehicles on Social Media
  • Fig 27 EV Charging Infrastructure Market – Revenue Opportunity Forecast, 2020-2030 ($M)
  • Fig 28 EV Charging Infrastructure Market –Volume Opportunity Forecast, 2020-2030 (Unit)
  • Fig 29 EV Charging Infrastructure Market, By Region, 2020-2030 ($M)
  • Fig 30 EV Charging Infrastructure Market, By Region, 2020-2030 (Unit)
  • Fig 31 EV Charging Infrastructure Market, By Power, 2020-2030 ($M)
  • Fig 32 EV Charging Infrastructure Market, By Power, 2020-2030 (Unit)
  • Fig 33 EV Charging Infrastructure Market, By Level, 2020-2030 ($M)
  • Fig 34 EV Charging Infrastructure Market, By Level, 2020-2030 (Unit)
  • Fig 35 Asia Pacific EV Charging Infrastructure Market – Revenue Opportunity Forecast, 2020-2030 ($M)
  • Fig 36 Asia Pacific EV Charging Infrastructure Market – Volume Opportunity Forecast, 2020-2030 (Units)
  • Fig 37 Asia Pacific EV Charging Infrastructure Market, By Country, 2020-2030 ($M)
  • Fig 38 Asia Pacific EV Charging Infrastructure Market, By Country, 2020-2030 (Units)
  • Fig 39 Asia Pacific EV Charging Infrastructure Market, By Power, 2020-2030 ($M)
  • Fig 40 Asia Pacific EV Charging Infrastructure Market, By Power, 2020-2030 (Unit)
  • Fig 41 Asia Pacific EV Charging Infrastructure Market, By Level, 2020-2030 ($M)
  • Fig 42 Asia Pacific EV Charging Infrastructure Market, By Level, 2020-2030 (Unit)
  • Fig 43 China EV Charging Infrastructure Market, By Power, 2020-2030 ($M)
  • Fig 44 China EV Charging Infrastructure Market, By Power, 2020-2030 (Unit)
  • Fig 45 China EV Charging Infrastructure Market, By Level, 2020-2030 ($M)
  • Fig 46 China EV Charging Infrastructure Market, By Level, 2020-2030 (Unit)
  • Fig 47 India EV Charging Infrastructure Market, By Power, 2020-2030 ($M)
  • Fig 48 India EV Charging Infrastructure Market, By Power, 2020-2030 (Unit)
  • Fig 49 India EV Charging Infrastructure Market, By Level, 2020-2030 ($M)
  • Fig 50 India EV Charging Infrastructure Market, By Level, 2020-2030 (Unit)
  • Fig 51 South Korea EV Charging Infrastructure Market, By Power, 2020-2030 ($M)
  • Fig 52 South Korea EV Charging Infrastructure Market, By Power, 2020-2030 (Unit)
  • Fig 53 South Korea EV Charging Infrastructure Market, By Level, 2020-2030 ($M)
  • Fig 54 South Korea EV Charging Infrastructure Market, By Level, 2020-2030 (Unit)
  • Fig 55 Rest of Asia Pacific EV Charging Infrastructure Market, By Power, 2020-2030 ($M)
  • Fig 56 Rest of Asia Pacific EV Charging Infrastructure Market, By Power, 2020-2030 (Unit)
  • Fig 57 Rest of Asia Pacific EV Charging Infrastructure Market, By Level, 2020-2030 ($M)
  • Fig 58 Rest of Asia Pacific EV Charging Infrastructure Market, By Level, 2020-2030 (Unit)
  • Fig 59 Europe EV Charging Infrastructure Market – Revenue Opportunity Forecast, 2020-2030 ($M)
  • Fig 60 Europe EV Charging Infrastructure Market – Volume Opportunity Forecast, 2020-2030 (Units)
  • Fig 61 Europe EV Charging Infrastructure Market, By Country, 2020-2030 ($M)
  • Fig 62 Europe EV Charging Infrastructure Market, By Country, 2020-2030 (Units)
  • Fig 63 Europe EV Charging Infrastructure Market, By Power, 2020-2030 ($M)
  • Fig 64 Europe EV Charging Infrastructure Market, By Power, 2020-2030 (Unit)
  • Fig 65 Europe EV Charging Infrastructure Market, By Level, 2020-2030 ($M)
  • Fig 66 Europe EV Charging Infrastructure Market, By Level, 2020-2030 (Unit)
  • Fig 67 France EV Charging Infrastructure Market, By Power, 2020-2030 ($M)
  • Fig 68 France EV Charging Infrastructure Market, By Power, 2020-2030 (Unit)
  • Fig 69 France EV Charging Infrastructure Market, By Level, 2020-2030 ($M)
  • Fig 70 France EV Charging Infrastructure Market, By Level, 2020-2030 (Unit)
  • Fig 71 Germany EV Charging Infrastructure Market, By Power, 2020-2030 ($M)
  • Fig 72 Germany EV Charging Infrastructure Market, By Power, 2020-2030 (Unit)
  • Fig 73 Germany EV Charging Infrastructure Market, By Level, 2020-2030 ($M)
  • Fig 74 Germany EV Charging Infrastructure Market, By Level, 2020-2030 (Unit)
  • Fig 75 Italy EV Charging Infrastructure Market, By Power, 2020-2030 ($M)
  • Fig 76 Italy EV Charging Infrastructure Market, By Power, 2020-2030 (Unit)
  • Fig 77 Italy EV Charging Infrastructure Market, By Level, 2020-2030 ($M)
  • Fig 78 Italy EV Charging Infrastructure Market, By Level, 2020-2030 (Unit)
  • Fig 79 Netherlands EV Charging Infrastructure Market, By Power, 2020-2030 ($M)
  • Fig 80 Netherlands EV Charging Infrastructure Market, By Power, 2020-2030 (Unit)
  • Fig 81 Netherlands EV Charging Infrastructure Market, By Level, 2020-2030 ($M)
  • Fig 82 Netherlands EV Charging Infrastructure Market, By Level, 2020-2030 (Unit)
  • Fig 83 Norway EV Charging Infrastructure Market, By Power, 2020-2030 ($M)
  • Fig 84 Norway EV Charging Infrastructure Market, By Power, 2020-2030 (Unit)
  • Fig 85 Norway EV Charging Infrastructure Market, By Level, 2020-2030 ($M)
  • Fig 86 Norway EV Charging Infrastructure Market, By Level, 2020-2030 (Unit)
  • Fig 87 Sweden EV Charging Infrastructure Market, By Power, 2020-2030 ($M)
  • Fig 88 Sweden EV Charging Infrastructure Market, By Power, 2020-2030 (Unit)
  • Fig 89 Sweden EV Charging Infrastructure Market, By Level, 2020-2030 ($M)
  • Fig 90 Sweden EV Charging Infrastructure Market, By Level, 2020-2030 (Unit)
  • Fig 91 UK EV Charging Infrastructure Market, By Power, 2020-2030 ($M)
  • Fig 92 UK EV Charging Infrastructure Market, By Power, 2020-2030 (Unit)
  • Fig 93 UK EV Charging Infrastructure Market, By Level, 2020-2030 ($M)
  • Fig 94 UK EV Charging Infrastructure Market, By Level, 2020-2030 (Unit)
  • Fig 95 Turkey EV Charging Infrastructure Market, By Power, 2020-2030 ($M)
  • Fig 96 Turkey EV Charging Infrastructure Market, By Power, 2020-2030 (Unit)
  • Fig 97 Turkey EV Charging Infrastructure Market, By Level, 2020-2030 ($M)
  • Fig 98 Turkey EV Charging Infrastructure Market, By Level, 2020-2030 (Unit)
  • Fig 99 Rest of Europe EV Charging Infrastructure Market, By Power, 2020-2030 ($M)
  • Fig 100 Rest of Europe EV Charging Infrastructure Market, By Power, 2020-2030 (Unit)
  • Fig 101 Rest of Europe EV Charging Infrastructure Market, By Level, 2020-2030 ($M)
  • Fig 102 Rest of Europe EV Charging Infrastructure Market, By Level, 2020-2030 (Unit)
  • Fig 103 Middle East & Africa EV Charging Infrastructure Market – Revenue Opportunity Forecast, 2020-2030 ($M)
  • Fig 104 Middle East & Africa EV Charging Infrastructure Market – Volume Opportunity Forecast, 2020-2030 (Units)
  • Fig 105 Middle East & Africa EV Charging Infrastructure Market, By Country, 2020-2030 ($M)
  • Fig 106 Middle East & Africa EV Charging Infrastructure Market, By Country, 2020-2030 (Units)
  • Fig 107 Middle East & Africa EV Charging Infrastructure Market, By Power, 2020-2030 ($M)
  • Fig 108 Middle East & Africa EV Charging Infrastructure Market, By Power, 2020-2030 (Unit)
  • Fig 109 Middle East & Africa EV Charging Infrastructure Market, By Level, 2020-2030 ($M)
  • Fig 110 Middle East & Africa EV Charging Infrastructure Market, By Level, 2020-2030 (Unit)
  • Fig 111 South Africa EV Charging Infrastructure Market, By Power, 2020-2030 ($M)
  • Fig 112 South Africa EV Charging Infrastructure Market, By Power, 2020-2030 (Unit)
  • Fig 113 South Africa EV Charging Infrastructure Market, By Level, 2020-2030 ($M)
  • Fig 114 South Africa EV Charging Infrastructure Market, By Level, 2020-2030 (Unit)
  • Fig 115 North America EV Charging Infrastructure Market – Revenue Opportunity Forecast, 2020-2030 ($M)
  • Fig 116 North America EV Charging Infrastructure Market – Volume Opportunity Forecast, 2020-2030 (Units)
  • Fig 117 North America EV Charging Infrastructure Market, By Country, 2020-2030 ($M)
  • Fig 118 North America EV Charging Infrastructure Market, By Country, 2020-2030 (Units)
  • Fig 119 North America EV Charging Infrastructure Market, By Power, 2020-2030 ($M)
  • Fig 120 North America EV Charging Infrastructure Market, By Power, 2020-2030 (Unit)
  • Fig 121 North America EV Charging Infrastructure Market, By Level, 2020-2030 ($M)
  • Fig 122 North America EV Charging Infrastructure Market, By Level, 2020-2030 (Unit)
  • Fig 123 US EV Charging Infrastructure Market, By Power, 2020-2030 ($M)
  • Fig 124 US EV Charging Infrastructure Market, By Power, 2020-2030 (Unit)
  • Fig 125 US EV Charging Infrastructure Market, By Level, 2020-2030 ($M)
  • Fig 126 US EV Charging Infrastructure Market, By Level, 2020-2030 (Unit)
  • Fig 127 Canada EV Charging Infrastructure Market, By Power, 2020-2030 ($M)
  • Fig 128 Canada EV Charging Infrastructure Market, By Power, 2020-2030 (Unit)
  • Fig 129 Canada EV Charging Infrastructure Market, By Level, 2020-2030 ($M)
  • Fig 130 Canada EV Charging Infrastructure Market, By Level, 2020-2030 (Unit)
  • Fig 131 Mexico EV Charging Infrastructure Market, By Power, 2020-2030 ($M)
  • Fig 132 Mexico EV Charging Infrastructure Market, By Power, 2020-2030 (Unit)
  • Fig 133 Mexico EV Charging Infrastructure Market, By Level, 2020-2030 ($M)
  • Fig 134 Mexico EV Charging Infrastructure Market, By Level, 2020-2030 (Unit)
  • Fig 135 South & Central America EV Charging Infrastructure Market – Revenue Opportunity Forecast, 2020-2030 ($M)
  • Fig 136 South & Central America EV Charging Infrastructure Market – Volume Opportunity Forecast, 2020-2030 (Units)
  • Fig 137 South & Central America EV Charging Infrastructure Market, By Country, 2020-2030 ($M)
  • Fig 138 South & Central America EV Charging Infrastructure Market, By Country, 2020-2030 (Units)
  • Fig 139 South & Central America EV Charging Infrastructure Market, By Power, 2020-2030 ($M)
  • Fig 140 South & Central America EV Charging Infrastructure Market, By Power, 2020-2030 (Unit)
  • Fig 141 South & Central America EV Charging Infrastructure Market, By Level, 2020-2030 ($M)
  • Fig 142 South & Central America EV Charging Infrastructure Market, By Level, 2020-2030 (Unit)
  • Fig 143 Brazil EV Charging Infrastructure Market, By Power, 2020-2030 ($M)
  • Fig 144 Brazil EV Charging Infrastructure Market, By Power, 2020-2030 (Unit)
  • Fig 145 Brazil EV Charging Infrastructure Market, By Level, 2020-2030 ($M)
  • Fig 146 Brazil EV Charging Infrastructure Market, By Level, 2020-2030 (Unit)
  • Fig 147 Chile EV Charging Infrastructure Market, By Power, 2020-2030 ($M)
  • Fig 148 Chile EV Charging Infrastructure Market, By Power, 2020-2030 (Unit)
  • Fig 149 Chile EV Charging Infrastructure Market, By Level, 2020-2030 ($M)
  • Fig 150 Chile EV Charging Infrastructure Market, By Level, 2020-2030 (Unit)
  • Fig 151 Research Methodology Steps
  • Fig 152 Core Objectives of the Market Study
  • Fig 153 Research Approach
  • Fig 154 Analysis Flow
  • Fig 155 Quality Control Flow

Frequently asked questions

Currency USD
$3,950

Can be used by individual purchaser only

$7,950

Can be shared globally by unlimited users within the purchasing corporation e.g. all employees of a single company


Undecided about purchasing this report?

Enquire Before Buying Request a Free Sample

Get in touch to find out about multi-purchase discounts

reportstore@globaldata.com
Tel +44 20 7947 2745

Every customer’s requirement is unique. With over 220,000 construction projects tracked, we can create a tailored dataset for you based on the types of projects you are looking for. Please get in touch with your specific requirements and we can send you a quote.

Sample Report

We are confident about Electric Vehicle (EV) Charging Infrastructure Market Size, Trends and Analysis by Region, Level, Power and Segment Forecast to 2030 report's unique quality. However, we want you to make the most beneficial decision for your business, so we offer free sample pages to help you:

  • Assess the relevance of the report
  • Evaluate the quality of the report
  • Justify the cost

Download your copy of the sample report and make an informed decision about whether the full report will provide you with the insights and information you need.

Below is a sample report to understand what you are buying

See what our customers are saying

“The GlobalData platform is our go-to tool for intelligence services. GlobalData provides an easy way to access comprehensive intelligence data around multiple sectors, which essentially makes it a one-for-all intelligence platform, for tendering and approaching customers.

GlobalData is very customer orientated, with a high degree of personalised services, which benefits everyday use. The highly detailed project intelligence and forecast reports can be utilised across multiple departments and workflow scopes, from operational to strategic level, and often support strategic decisions. GlobalData Analytics and visualisation solutions has contributed positively when preparing management presentations and strategic papers.”

Business Intelligence & Marketing Manager, SAL Heavy Lift

“COVID-19 has caused significant interference to our business and the COVID-19 intelligence from GlobalData has helped us reach better decisions around strategy. These two highlights have helped enormously to understand the projections into the future concerning our business units, we also utilise the project database to source new projects for Liebherr-Werk to use as an additional source to pitch for new business.”

Market Analyst & Management, Liebherr-Werk

Your daily news has saved me a lot of time and keeps me up-to-date with what is happening in the market, I like that you almost always have a link to the source origin. We also use your market data in our Strategic Business Process to support our business decisions. By having everything in one place on the Intelligence Center it has saved me a lot of time versus looking on different sources, the alert function also helps with this.

Head of Key Accounts, Saab AB

Having used several other market research companies, I find that GlobalData manages to provide that ‘difficult-to-get’ market data that others can’t, as well as very diverse and complete consumer surveys.

Marketing Intelligence Manager, Portugal Foods

Our experience with GlobalData has been very good, from the platform itself to the people. I find that the analysts and the account team have a high level of customer focus and responsiveness and therefore I can always rely on. The platform is more holistic than other providers. It is convenient and almost like a one stop shop. The pricing suite is highly competitive and value for our organisation.

I like reports that inform new segments such as the analysis on generation Z, millennials, the impact of COVID 19 to our banking customers and their new channel habits. Secondly the specialist insight on affluent sector significantly increases our understanding about this group of customers. The combination of those give us depth and breadth of the evolving market.

I’m in the business of answering and helping people make decisions so with the intelligence center I can do that, effectively and efficiently. I can share quickly key insights that answer and satisfy our country stakeholders by giving them many quality studies and primary research about competitive landscape beyond the outlook of our bank. It helps me be seen as an advisory partner and that makes a big difference. A big benefit of our subscription is that no one holds the whole data and because it allows so many people, so many different parts of our organisation have access, it enables all teams to have the same level of knowledge and decision support.

Head of Customer Insight and Research, Standard Chartered

“I know that I can always rely on Globaldata’s work when I’m searching for the right consumer and market insights. I use Globaldata insights to understand the changing market & consumer landscape and help create better taste & wellbeing solutions for our customers in food, beverage and healthcare industries.

Globaldata has the right data and the reports are of very high quality compared to your competitors. Globaldata not only has overall market sizes & consumer insights on food & beverages but also provides insights at the ingredient & flavour level. That is key for B2B companies like Givaudan. This way we understand our customers’ business and also gain insight to our unique industry”

Head of Consumer Sensory Insights, Givaudan

GlobalData provides a great range of information and reports on various sectors that is highly relevant, timely, easy to access and utilise.  The reports and data dashboards help engagement with clients; they provide valuable industry and market insights that can enrich client conversations and can help in the shaping of value propositions. Moreover, using GlobalData products has helped increase my knowledge of the finance sector, the players within it, and the general threats and opportunities.

I find the consumer surveys that are carried out to be extremely beneficial and not something I have seen anywhere else. They provided an insightful view of why and which consumers take (or don’t) particular financial products. This can help shape conversations with clients to ensure they make the right strategic decisions for their business.

One of the challenges I have found is that data in the payments space is often piecemeal. With GD all of the data I need is in one place, but it also comes with additional market reports that provide useful extra context and information. Having the ability to set-up alerts on relevant movements in the industry, be it competitors or customers, and have them emailed directly to me, ensures I get early sight of industry activity and don’t have to search for news.

Senior Account Manager, TSYS
Go even deeper with GlobalData Intelligence Center

Every Company Report we produce is powered by the GlobalData Intelligence Center.

Subscribing to our intelligence platform means you can monitor developments at Electric Vehicle (EV) Charging Infrastructure Market Size, Trends and Analysis by Region, Level, Power and Segment Forecast to 2030 in real time.

  • Access a live Electric Vehicle (EV) Charging Infrastructure Market Size, Trends and Analysis by Region, Level, Power and Segment Forecast to 2030 dashboard for 12 months, with up-to-the-minute insights.
  • Fuel your decision making with real-time deal coverage and media activity.
  • Turn insights on financials, deals, products and pipelines into powerful agents of commercial advantage.