G8 Countries Car Manufacturing Market Summary, Competitive Analysis and Forecast to 2026

Powered by

All the vital news, analysis, and commentary curated by our industry experts.

$1995

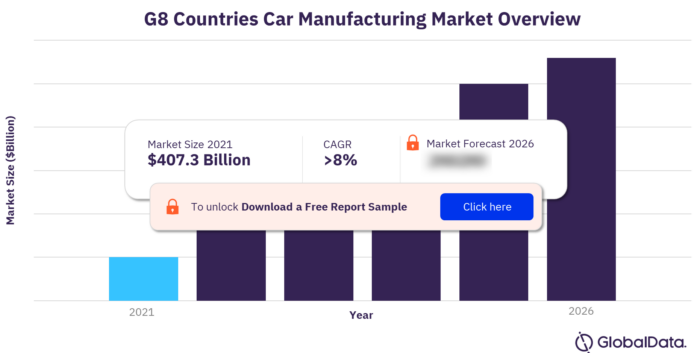
The G8 countries contributed $407.3 billion in 2021 to the global car manufacturing industry, and it is expected to grow at a CAGR of more than 8% between 2021 and 2026. The G8 countries car manufacturing market research report provides qualitative and quantitative information including market size and forecast of the car manufacturing industry among the G8 nations. The profile also contains descriptions of the leading players including key financial metrics and an analysis of competitive pressures within the market.

G8 Countries Car Manufacturing Market Summary

For more insights on key countries, download a free report sample

Key Nations in the G8 Countries Car Manufacturing Market

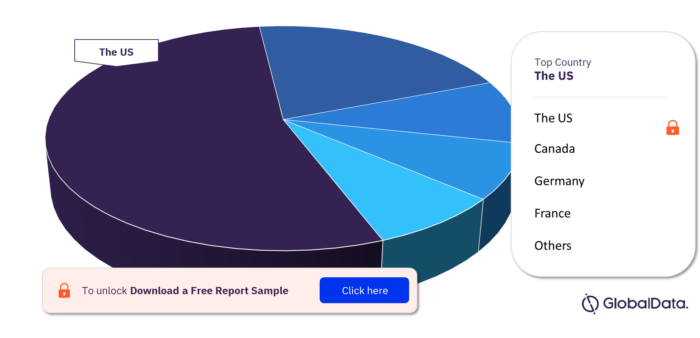
The Group of Eight (G8) comprises eight of the fastest growing industrial nations in the world: the US, Canada, Germany, France, the UK, Italy, Russia, and Japan. Among the G8 countries, the US is the leading country in the car manufacturing industry, followed by Japan and Germany.

The US: Temporary shutdowns in the US car manufacturing plants amid labor shortages and severe disruption in the supply chain, including a shortage of semiconductors which persisted throughout the COVID-19 pandemic, led to a steep decline in production.

Canada: Canada is a net exporter of cars, with Stellantis, Honda, and Ford among the largest manufactures operating locally. In terms of value, the majority of cars manufactured in Canada are exported to the US.

Germany: Despite the declines seen in the German car manufacturing industry, which is the largest in Europe  industry in recent years, the hybrid and electric cars segment has been a bright spot.

The G8 Countries Car Manufacturing Market, by key countries

The G8 Countries Car Manufacturing Market, by key countries

For more insights on key countries, download a free report sample

Key Companies in the G8 Countries Car Manufacturing Market

The key companies in the G8 countries car manufacturing market are Honda Motor Co., Ltd., Toyota Motor Corporation, Daimler AG, Volkswagen AG, Bayerische Motoren Werke AG, Stellantis NV, Ferrari SpA, Suzuki Motor Corporation and Mazda Motor Corporation among others.

Honda Motor Co., Ltd.: Honda is primarily involved in the development, production, and sales of a variety of automobiles, motorcycles, and power products. The company also provides a range of financial services to its customers and dealers. Honda operates through a global network subsidiaries and affiliates operating over the world. It primarily operates in North and South America, Asia, the Middle East and Europe.

Toyota Motor Corporation: Toyota designs, manufactures and sale of sedans, minivans, compact cars, sports utility vehicles, trucks and related parts and accessories throughout the world. It also provides financing, vehicle and equipment leasing, and certain other financial services primarily to its dealers and their customers to support the sales of vehicles and other products manufactured by Toyota.

Daimler AG: Daimler manufacturers, distributes and sells a range of cars, trucks, vans and buses. The company also offers a choice of tailored automotive services and automotive financial services, including financing, leasing, insurance, and fleet management.

Market Report Overview

Market Size (2021) $407.3 billion
CAGR (2021-2026) >8%
Key Countries The US, Canada, Germany, France, the UK, Italy, Russia and Japan
Key Companies Honda Motor Co., Ltd., Toyota Motor Corporation, Daimler AG, Volkswagen AG, Bayerische Motoren Werke AG, Stellantis NV, Ferrari SpA, Suzuki Motor Corporation and Mazda Motor Corporation

Scope

  • Save time carrying out entry-level research by identifying the size, growth, and leading players in the G8 car manufacturing Industry
  • Use the Five Forces analysis to determine the competitive intensity and therefore attractiveness of the G8 car manufacturing Industry
  • Leading company profiles reveal details of key car manufacturing Industry players’ G8 operations and financial performance
  • Add weight to presentations and pitches by understanding the future growth prospects of the G8 car manufacturing Industry with five year forecasts by both value and volume
  • Compares data from the US, Canada, Germany, France, UK, Italy, Russia and Japan, alongside individual chapters on each country

Reasons to Buy

  • What was the size of the G8 car manufacturing Industry by value in 2021?
  • What will be the size of the G8 car manufacturing Industry in 2026?
  • What factors are affecting the strength of competition in the G8 car manufacturing Industry?
  • How has the industry performed over the last five years?
  • Who are the top competitors in the G8 car manufacturing Industry?

Honda Motor Co., Ltd.
Ford Motor Company Limited
Toyota Motor Corporation
Daimler AG
Volkswagen AG
Bayerische Motoren Werke AG
Stellantis NV
Ferrari SpA
Suzuki Motor Corporation
Mazda Motor Corporation
Renault SA
Hyundai Motor Company
Tata Motors Limited
Nissan Motor Co., Ltd.
Tesla, Inc.

Table of Contents

Table of Contents

1 Introduction

1.1. What is this report about?

1.2. Who is the target reader?

1.3. How to use this report

1.4. Definitions

2 Group of Eight (G8) Car Manufacturing

2.1. Industry Outlook

3 Car Manufacturing in Canada

3.1. Market Overview

3.2. Market Data

3.3. Market Segmentation

3.4. Market outlook

3.5. Five forces analysis

4 Macroeconomic Indicators

4.1. Country data

5 Car Manufacturing in France

5.1. Market Overview

5.2. Market Data

5.3. Market Segmentation

5.4. Market outlook

5.5. Five forces analysis

6 Macroeconomic Indicators

6.1. Country data

7 Car Manufacturing in Germany

7.1. Market Overview

7.2. Market Data

7.3. Market Segmentation

7.4. Market outlook

7.5. Five forces analysis

8 Macroeconomic Indicators

8.1. Country data

9 Car Manufacturing in Italy

9.1. Market Overview

9.2. Market Data

9.3. Market Segmentation

9.4. Market outlook

9.5. Five forces analysis

10 Macroeconomic Indicators

10.1. Country data

11 Car Manufacturing in Japan

11.1. Market Overview

11.2. Market Data

11.3. Market Segmentation

11.4. Market outlook

11.5. Five forces analysis

12 Macroeconomic Indicators

12.1. Country data

13 Car Manufacturing in Russia

13.1. Market Overview

13.2. Market Data

13.3. Market Segmentation

13.4. Market outlook

13.5. Five forces analysis

14 Macroeconomic Indicators

14.1. Country data

15 Car Manufacturing in The United Kingdom

15.1. Market Overview

15.2. Market Data

15.3. Market Segmentation

15.4. Market outlook

15.5. Five forces analysis

16 Macroeconomic Indicators

16.1. Country data

17 Car Manufacturing in The United States

17.1. Market Overview

17.2. Market Data

17.3. Market Segmentation

17.4. Market outlook

17.5. Five forces analysis

18 Macroeconomic Indicators

18.1. Country data

19 Company Profiles

19.1. Honda Motor Co., Ltd.

19.2. Ford Motor Company Limited

19.3. Toyota Motor Corporation

19.4. Daimler AG

19.5. Volkswagen AG

19.6. Bayerische Motoren Werke AG

19.7. Stellantis NV

19.8. Ferrari SpA

19.9. Suzuki Motor Corporation

19.10. Mazda Motor Corporation

19.11. Renault SA

19.12. Hyundai Motor Company

19.13. Tata Motors Limited

19.14. Nissan Motor Co., Ltd.

19.15. Tesla, Inc.

20 Appendix

20.1. Methodology

20.2. About GlobalData

Table

List of Tables

Table 1: G8 car manufacturing industry, revenue($bn), 2017-26

Table 2: G8 car manufacturing industry, revenue by country ($bn), 2017-21

Table 3: G8 car manufacturing industry forecast, revenue by country ($bn), 2021-26

Table 4: Canada car manufacturing industry value: $ billion, 2017–21

Table 5: Canada car manufacturing industry volume: thousand units, 2017–21

Table 6: Canada car manufacturing industry geography segmentation: $ billion, 2021

Table 7: Canada car manufacturing industry share: % share, by volume, 2021

Table 8: Canada car manufacturing industry value forecast: $ billion, 2021–26

Table 9: Canada car manufacturing industry volume forecast: thousand units, 2021–26

Table 10: Canada size of population (million), 2017–21

Table 11: Canada gdp (constant 2005 prices, $ billion), 2017–21

Table 12: Canada gdp (current prices, $ billion), 2017–21

Table 13: Canada inflation, 2017–21

Table 14: Canada consumer price index (absolute), 2017–21

Table 15: Canada exchange rate, 2017–21

Table 16: France car manufacturing industry value: $ billion, 2017–21

Table 17: France car manufacturing industry volume: thousand units, 2017–21

Table 18: France car manufacturing industry geography segmentation: $ billion, 2021

Table 19: France car manufacturing industry share: % share, by volume, 2021

Table 20: France car manufacturing industry value forecast: $ billion, 2021–26

Table 21: France car manufacturing industry volume forecast: thousand units, 2021–26

Table 22: France size of population (million), 2017–21

Table 23: France gdp (constant 2005 prices, $ billion), 2017–21

Table 24: France gdp (current prices, $ billion), 2017–21

Table 25: France inflation, 2017–21

Table 26: France consumer price index (absolute), 2017–21

Table 27: France exchange rate, 2017–21

Table 28: Germany car manufacturing industry value: $ billion, 2017–21

Table 29: Germany car manufacturing industry volume: thousand units, 2017–21

Table 30: Germany car manufacturing industry geography segmentation: $ billion, 2021

Table 31: Germany car manufacturing industry share: % share, by volume, 2021

Table 32: Germany car manufacturing industry value forecast: $ billion, 2021–26

Table 33: Germany car manufacturing industry volume forecast: thousand units, 2021–26

Table 34: Germany size of population (million), 2017–21

Table 35: Germany gdp (constant 2005 prices, $ billion), 2017–21

Table 36: Germany gdp (current prices, $ billion), 2017–21

Table 37: Germany inflation, 2017–21

Table 38: Germany consumer price index (absolute), 2017–21

Table 39: Germany exchange rate, 2017–21

Table 40: Italy car manufacturing industry value: $ billion, 2017–21

Table 41: Italy car manufacturing industry volume: thousand units, 2017–21

Table 42: Italy car manufacturing industry geography segmentation: $ billion, 2021

Table 43: Italy car manufacturing industry share: % share, by volume, 2021

Table 44: Italy car manufacturing industry value forecast: $ billion, 2021–26

Table 45: Italy car manufacturing industry volume forecast: thousand units, 2021–26

Table 46: Italy size of population (million), 2017–21

Table 47: Italy gdp (constant 2005 prices, $ billion), 2017–21

Table 48: Italy gdp (current prices, $ billion), 2017–21

Table 49: Italy inflation, 2017–21

Table 50: Italy consumer price index (absolute), 2017–21

Table 51: Italy exchange rate, 2017–21

Table 52: Japan car manufacturing industry value: $ billion, 2017–21

Table 53: Japan car manufacturing industry volume: thousand units, 2017–21

Table 54: Japan car manufacturing industry geography segmentation: $ billion, 2021

Table 55: Japan car manufacturing industry share: % share, by volume, 2021

Table 56: Japan car manufacturing industry value forecast: $ billion, 2021–26

Table 57: Japan car manufacturing industry volume forecast: thousand units, 2021–26

Table 58: Japan size of population (million), 2017–21

Table 59: Japan gdp (constant 2005 prices, $ billion), 2017–21

Table 60: Japan gdp (current prices, $ billion), 2017–21

Table 61: Japan inflation, 2017–21

Table 62: Japan consumer price index (absolute), 2017–21

Table 63: Japan exchange rate, 2017–21

Table 64: Russia car manufacturing industry value: $ billion, 2017–21

Table 65: Russia car manufacturing industry volume: thousand units, 2017–21

Table 66: Russia car manufacturing industry geography segmentation: $ billion, 2021

Table 67: Russia car manufacturing industry share: % share, by volume, 2021

Table 68: Russia car manufacturing industry value forecast: $ billion, 2021–26

Table 69: Russia car manufacturing industry volume forecast: thousand units, 2021–26

Table 70: Russia size of population (million), 2017–21

Table 71: Russia gdp (constant 2005 prices, $ billion), 2017–21

Table 72: Russia gdp (current prices, $ billion), 2017–21

Table 73: Russia inflation, 2017–21

Table 74: Russia consumer price index (absolute), 2017–21

Table 75: Russia exchange rate, 2017–21

Table 76: United Kingdom car manufacturing industry value: $ billion, 2017–21

Table 77: United Kingdom car manufacturing industry volume: thousand units, 2017–21

Table 78: United Kingdom car manufacturing industry geography segmentation: $ billion, 2021

Table 79: United Kingdom car manufacturing industry share: % share, by volume, 2021

Table 80: United Kingdom car manufacturing industry value forecast: $ billion, 2021–26

Table 81: United Kingdom car manufacturing industry volume forecast: thousand units, 2021–26

Table 82: United Kingdom size of population (million), 2017–21

Table 83: United Kingdom gdp (constant 2005 prices, $ billion), 2017–21

Table 84: United Kingdom gdp (current prices, $ billion), 2017–21

Table 85: United Kingdom inflation, 2017–21

Table 86: United Kingdom consumer price index (absolute), 2017–21

Table 87: United Kingdom exchange rate, 2017–21

Table 88: United States car manufacturing industry value: $ billion, 2017–21

Table 89: United States car manufacturing industry volume: thousand units, 2017–21

Table 90: United States car manufacturing industry geography segmentation: $ billion, 2021

Table 91: United States car manufacturing industry share: % share, by volume, 2021

Table 92: United States car manufacturing industry value forecast: $ billion, 2021–26

Table 93: United States car manufacturing industry volume forecast: thousand units, 2021–26

Table 94: United States size of population (million), 2017–21

Table 95: United States gdp (constant 2005 prices, $ billion), 2017–21

Table 96: United States gdp (current prices, $ billion), 2017–21

Table 97: United States inflation, 2017–21

Table 98: United States consumer price index (absolute), 2017–21

Table 99: United States exchange rate, 2017–21

Table 100: Honda Motor Co., Ltd.: key facts

Table 101: Honda Motor Co., Ltd.: Annual Financial Ratios

Table 102: Honda Motor Co., Ltd.: Key Employees

Table 103: Honda Motor Co., Ltd.: Key Employees Continued

Table 104: Honda Motor Co., Ltd.: Key Employees Continued

Table 105: Ford Motor Company Limited: key facts

Table 106: Ford Motor Company Limited: Key Employees

Table 107: Toyota Motor Corporation: key facts

Table 108: Toyota Motor Corporation: Annual Financial Ratios

Table 109: Toyota Motor Corporation: Key Employees

Table 110: Toyota Motor Corporation: Key Employees Continued

Table 111: Toyota Motor Corporation: Key Employees Continued

Table 112: Daimler AG: key facts

Table 113: Daimler AG: Annual Financial Ratios

Table 114: Daimler AG: Key Employees

Table 115: Daimler AG: Key Employees Continued

Table 116: Volkswagen AG: key facts

Table 117: Volkswagen AG: Annual Financial Ratios

Table 118: Volkswagen AG: Key Employees

Table 119: Volkswagen AG: Key Employees Continued

Table 120: Volkswagen AG: Key Employees Continued

Table 121: Bayerische Motoren Werke AG: key facts

Table 122: Bayerische Motoren Werke AG: Annual Financial Ratios

Table 123: Bayerische Motoren Werke AG: Key Employees

Table 124: Bayerische Motoren Werke AG: Key Employees Continued

Table 125: Stellantis NV: key facts

Table 126: Stellantis NV: Annual Financial Ratios

Table 127: Stellantis NV: Key Employees

Table 128: Stellantis NV: Key Employees Continued

Table 129: Stellantis NV: Key Employees Continued

Table 130: Ferrari SpA: key facts

Table 131: Ferrari SpA: Key Employees

Table 132: Suzuki Motor Corporation: key facts

Table 133: Suzuki Motor Corporation: Annual Financial Ratios

Table 134: Suzuki Motor Corporation: Key Employees

Table 135: Suzuki Motor Corporation: Key Employees Continued

Table 136: Mazda Motor Corporation: key facts

Table 137: Mazda Motor Corporation: Annual Financial Ratios

Table 138: Mazda Motor Corporation: Key Employees

Table 139: Mazda Motor Corporation: Key Employees Continued

Table 140: Mazda Motor Corporation: Key Employees Continued

Table 141: Renault SA: key facts

Table 142: Renault SA: Annual Financial Ratios

Table 143: Renault SA: Key Employees

Table 144: Renault SA: Key Employees Continued

Table 145: Renault SA: Key Employees Continued

Table 146: Renault SA: Key Employees Continued

Table 147: Hyundai Motor Company: key facts

Table 148: Hyundai Motor Company: Annual Financial Ratios

Table 149: Hyundai Motor Company: Key Employees

Table 150: Tata Motors Limited: key facts

Table 151: Tata Motors Limited: Annual Financial Ratios

Table 152: Tata Motors Limited: Key Employees

Table 153: Nissan Motor Co., Ltd.: key facts

Table 154: Nissan Motor Co., Ltd.: Annual Financial Ratios

Table 155: Nissan Motor Co., Ltd.: Key Employees

Table 156: Nissan Motor Co., Ltd.: Key Employees Continued

Table 157: Nissan Motor Co., Ltd.: Key Employees Continued

Table 158: Nissan Motor Co., Ltd.: Key Employees Continued

Table 159: Tesla, Inc.: key facts

Table 160: Tesla, Inc.: Annual Financial Ratios

Table 161: Tesla, Inc.: Key Employees

Figures

List of Figures

Figure 1: G8 car manufacturing industry, revenue($bn), 2017-26

Figure 2: G8 Car Manufacturing industry, revenue by country (%), 2021

Figure 3: G8 car manufacturing industry, revenue by country ($bn), 2017-21

Figure 4: G8 car manufacturing industry forecast, revenue by country ($bn), 2021-26

Figure 5: Canada car manufacturing industry value: $ billion, 2017–21

Figure 6: Canada car manufacturing industry volume: thousand units, 2017–21

Figure 7: Canada car manufacturing industry geography segmentation: % share, by value, 2021

Figure 8: Canada car manufacturing industry share: % share, by volume, 2021

Figure 9: Canada car manufacturing industry value forecast: $ billion, 2021–26

Figure 10: Canada car manufacturing industry volume forecast: thousand units, 2021–26

Figure 11: Forces driving competition in the car manufacturing industry in Canada, 2021

Figure 12: Drivers of buyer power in the car manufacturing industry in Canada, 2021

Figure 13: Drivers of supplier power in the car manufacturing industry in Canada, 2021

Figure 14: Factors influencing the likelihood of new entrants in the car manufacturing industry in Canada, 2021

Figure 15: Factors influencing the threat of substitutes in the car manufacturing industry in Canada, 2021

Figure 16: Drivers of degree of rivalry in the car manufacturing industry in Canada, 2021

Figure 17: France car manufacturing industry value: $ billion, 2017–21

Figure 18: France car manufacturing industry volume: thousand units, 2017–21

Figure 19: France car manufacturing industry geography segmentation: % share, by value, 2021

Figure 20: France car manufacturing industry share: % share, by volume, 2021

Figure 21: France car manufacturing industry value forecast: $ billion, 2021–26

Figure 22: France car manufacturing industry volume forecast: thousand units, 2021–26

Figure 23: Forces driving competition in the car manufacturing industry in France, 2021

Figure 24: Drivers of buyer power in the car manufacturing industry in France, 2021

Figure 25: Drivers of supplier power in the car manufacturing industry in France, 2021

Figure 26: Factors influencing the likelihood of new entrants in the car manufacturing industry in France, 2021

Figure 27: Factors influencing the threat of substitutes in the car manufacturing industry in France, 2021

Figure 28: Drivers of degree of rivalry in the car manufacturing industry in France, 2021

Figure 29: Germany car manufacturing industry value: $ billion, 2017–21

Figure 30: Germany car manufacturing industry volume: thousand units, 2017–21

Figure 31: Germany car manufacturing industry geography segmentation: % share, by value, 2021

Figure 32: Germany car manufacturing industry share: % share, by volume, 2021

Figure 33: Germany car manufacturing industry value forecast: $ billion, 2021–26

Figure 34: Germany car manufacturing industry volume forecast: thousand units, 2021–26

Figure 35: Forces driving competition in the car manufacturing industry in Germany, 2021

Figure 36: Drivers of buyer power in the car manufacturing industry in Germany, 2021

Figure 37: Drivers of supplier power in the car manufacturing industry in Germany, 2021

Figure 38: Factors influencing the likelihood of new entrants in the car manufacturing industry in Germany, 2021

Figure 39: Factors influencing the threat of substitutes in the car manufacturing industry in Germany, 2021

Figure 40: Drivers of degree of rivalry in the car manufacturing industry in Germany, 2021

Figure 41: Italy car manufacturing industry value: $ billion, 2017–21

Figure 42: Italy car manufacturing industry volume: thousand units, 2017–21

Figure 43: Italy car manufacturing industry geography segmentation: % share, by value, 2021

Figure 44: Italy car manufacturing industry share: % share, by volume, 2021

Figure 45: Italy car manufacturing industry value forecast: $ billion, 2021–26

Figure 46: Italy car manufacturing industry volume forecast: thousand units, 2021–26

Figure 47: Forces driving competition in the car manufacturing industry in Italy, 2021

Figure 48: Drivers of buyer power in the car manufacturing industry in Italy, 2021

Figure 49: Drivers of supplier power in the car manufacturing industry in Italy, 2021

Figure 50: Factors influencing the likelihood of new entrants in the car manufacturing industry in Italy, 2021

Figure 51: Factors influencing the threat of substitutes in the car manufacturing industry in Italy, 2021

Figure 52: Drivers of degree of rivalry in the car manufacturing industry in Italy, 2021

Figure 53: Japan car manufacturing industry value: $ billion, 2017–21

Figure 54: Japan car manufacturing industry volume: thousand units, 2017–21

Figure 55: Japan car manufacturing industry geography segmentation: % share, by value, 2021

Figure 56: Japan car manufacturing industry share: % share, by volume, 2021

Figure 57: Japan car manufacturing industry value forecast: $ billion, 2021–26

Figure 58: Japan car manufacturing industry volume forecast: thousand units, 2021–26

Figure 59: Forces driving competition in the car manufacturing industry in Japan, 2021

Figure 60: Drivers of buyer power in the car manufacturing industry in Japan, 2021

Figure 61: Drivers of supplier power in the car manufacturing industry in Japan, 2021

Figure 62: Factors influencing the likelihood of new entrants in the car manufacturing industry in Japan, 2021

Figure 63: Factors influencing the threat of substitutes in the car manufacturing industry in Japan, 2021

Figure 64: Drivers of degree of rivalry in the car manufacturing industry in Japan, 2021

Figure 65: Russia car manufacturing industry value: $ billion, 2017–21

Figure 66: Russia car manufacturing industry volume: thousand units, 2017–21

Figure 67: Russia car manufacturing industry geography segmentation: % share, by value, 2021

Figure 68: Russia car manufacturing industry share: % share, by volume, 2021

Figure 69: Russia car manufacturing industry value forecast: $ billion, 2021–26

Figure 70: Russia car manufacturing industry volume forecast: thousand units, 2021–26

Figure 71: Forces driving competition in the car manufacturing industry in Russia, 2021

Figure 72: Drivers of buyer power in the car manufacturing industry in Russia, 2021

Figure 73: Drivers of supplier power in the car manufacturing industry in Russia, 2021

Figure 74: Factors influencing the likelihood of new entrants in the car manufacturing industry in Russia, 2021

Figure 75: Factors influencing the threat of substitutes in the car manufacturing industry in Russia, 2021

Figure 76: Drivers of degree of rivalry in the car manufacturing industry in Russia, 2021

Figure 77: United Kingdom car manufacturing industry value: $ billion, 2017–21

Figure 78: United Kingdom car manufacturing industry volume: thousand units, 2017–21

Figure 79: United Kingdom car manufacturing industry geography segmentation: % share, by value, 2021

Figure 80: United Kingdom car manufacturing industry share: % share, by volume, 2021

Figure 81: United Kingdom car manufacturing industry value forecast: $ billion, 2021–26

Figure 82: United Kingdom car manufacturing industry volume forecast: thousand units, 2021–26

Figure 83: Forces driving competition in the car manufacturing industry in the United Kingdom, 2021

Figure 84: Drivers of buyer power in the car manufacturing industry in the United Kingdom, 2021

Figure 85: Drivers of supplier power in the car manufacturing industry in the United Kingdom, 2021

Figure 86: Factors influencing the likelihood of new entrants in the car manufacturing industry in the United Kingdom, 2021

Figure 87: Factors influencing the threat of substitutes in the car manufacturing industry in the United Kingdom, 2021

Figure 88: Drivers of degree of rivalry in the car manufacturing industry in the United Kingdom, 2021

Figure 89: United States car manufacturing industry value: $ billion, 2017–21

Figure 90: United States car manufacturing industry volume: thousand units, 2017–21

Figure 91: United States car manufacturing industry geography segmentation: % share, by value, 2021

Figure 92: United States car manufacturing industry share: % share, by volume, 2021

Figure 93: United States car manufacturing industry value forecast: $ billion, 2021–26

Figure 94: United States car manufacturing industry volume forecast: thousand units, 2021–26

Figure 95: Forces driving competition in the car manufacturing industry in the United States, 2021

Figure 96: Drivers of buyer power in the car manufacturing industry in the United States, 2021

Figure 97: Drivers of supplier power in the car manufacturing industry in the United States, 2021

Figure 98: Factors influencing the likelihood of new entrants in the car manufacturing industry in the United States, 2021

Figure 99: Factors influencing the threat of substitutes in the car manufacturing industry in the United States, 2021

Figure 100: Drivers of degree of rivalry in the car manufacturing industry in the United States, 2021

Frequently asked questions

G8 Countries Car Manufacturing Market Summary, Competitive Analysis and Forecast to 2026 thematic reports
Currency USD
$1,995

Can be used by individual purchaser only

$3,990

Can be shared globally by unlimited users within the purchasing corporation e.g. all employees of a single company


Undecided about purchasing this report?

Enquire Before Buying

Get in touch to find out about multi-purchase discounts

reportstore@globaldata.com
Tel +44 20 7947 2745

Every customer’s requirement is unique. With over 220,000 construction projects tracked, we can create a tailored dataset for you based on the types of projects you are looking for. Please get in touch with your specific requirements and we can send you a quote.

See what our customers are saying

“The GlobalData platform is our go-to tool for intelligence services. GlobalData provides an easy way to access comprehensive intelligence data around multiple sectors, which essentially makes it a one-for-all intelligence platform, for tendering and approaching customers.

GlobalData is very customer orientated, with a high degree of personalised services, which benefits everyday use. The highly detailed project intelligence and forecast reports can be utilised across multiple departments and workflow scopes, from operational to strategic level, and often support strategic decisions. GlobalData Analytics and visualisation solutions has contributed positively when preparing management presentations and strategic papers.”

Business Intelligence & Marketing Manager, SAL Heavy Lift

“COVID-19 has caused significant interference to our business and the COVID-19 intelligence from GlobalData has helped us reach better decisions around strategy. These two highlights have helped enormously to understand the projections into the future concerning our business units, we also utilise the project database to source new projects for Liebherr-Werk to use as an additional source to pitch for new business.”

Market Analyst & Management, Liebherr-Werk

Your daily news has saved me a lot of time and keeps me up-to-date with what is happening in the market, I like that you almost always have a link to the source origin. We also use your market data in our Strategic Business Process to support our business decisions. By having everything in one place on the Intelligence Center it has saved me a lot of time versus looking on different sources, the alert function also helps with this.

Head of Key Accounts, Saab AB

Having used several other market research companies, I find that GlobalData manages to provide that ‘difficult-to-get’ market data that others can’t, as well as very diverse and complete consumer surveys.

Marketing Intelligence Manager, Portugal Foods

Our experience with GlobalData has been very good, from the platform itself to the people. I find that the analysts and the account team have a high level of customer focus and responsiveness and therefore I can always rely on. The platform is more holistic than other providers. It is convenient and almost like a one stop shop. The pricing suite is highly competitive and value for our organisation.

I like reports that inform new segments such as the analysis on generation Z, millennials, the impact of COVID 19 to our banking customers and their new channel habits. Secondly the specialist insight on affluent sector significantly increases our understanding about this group of customers. The combination of those give us depth and breadth of the evolving market.

I’m in the business of answering and helping people make decisions so with the intelligence center I can do that, effectively and efficiently. I can share quickly key insights that answer and satisfy our country stakeholders by giving them many quality studies and primary research about competitive landscape beyond the outlook of our bank. It helps me be seen as an advisory partner and that makes a big difference. A big benefit of our subscription is that no one holds the whole data and because it allows so many people, so many different parts of our organisation have access, it enables all teams to have the same level of knowledge and decision support.

Head of Customer Insight and Research, Standard Chartered

“I know that I can always rely on Globaldata’s work when I’m searching for the right consumer and market insights. I use Globaldata insights to understand the changing market & consumer landscape and help create better taste & wellbeing solutions for our customers in food, beverage and healthcare industries.

Globaldata has the right data and the reports are of very high quality compared to your competitors. Globaldata not only has overall market sizes & consumer insights on food & beverages but also provides insights at the ingredient & flavour level. That is key for B2B companies like Givaudan. This way we understand our customers’ business and also gain insight to our unique industry”

Head of Consumer Sensory Insights, Givaudan

GlobalData provides a great range of information and reports on various sectors that is highly relevant, timely, easy to access and utilise.  The reports and data dashboards help engagement with clients; they provide valuable industry and market insights that can enrich client conversations and can help in the shaping of value propositions. Moreover, using GlobalData products has helped increase my knowledge of the finance sector, the players within it, and the general threats and opportunities.

I find the consumer surveys that are carried out to be extremely beneficial and not something I have seen anywhere else. They provided an insightful view of why and which consumers take (or don’t) particular financial products. This can help shape conversations with clients to ensure they make the right strategic decisions for their business.

One of the challenges I have found is that data in the payments space is often piecemeal. With GD all of the data I need is in one place, but it also comes with additional market reports that provide useful extra context and information. Having the ability to set-up alerts on relevant movements in the industry, be it competitors or customers, and have them emailed directly to me, ensures I get early sight of industry activity and don’t have to search for news.

Senior Account Manager, TSYS
Go even deeper with GlobalData Intelligence Center

Every Company Report we produce is powered by the GlobalData Intelligence Center.

Subscribing to our intelligence platform means you can monitor developments at G8 Countries Car Manufacturing Market Summary, Competitive Analysis and Forecast to 2026 in real time.

  • Access a live G8 Countries Car Manufacturing Market Summary, Competitive Analysis and Forecast to 2026 dashboard for 12 months, with up-to-the-minute insights.
  • Fuel your decision making with real-time deal coverage and media activity.
  • Turn insights on financials, deals, products and pipelines into powerful agents of commercial advantage.