Ghana Defense Market Size, Trends, Budget Allocation, Regulations, Acquisitions, Competitive Landscape and Forecast to 2029

Powered by

All the vital news, analysis, and commentary curated by our industry experts.

Ghana Defense Market Report Overview

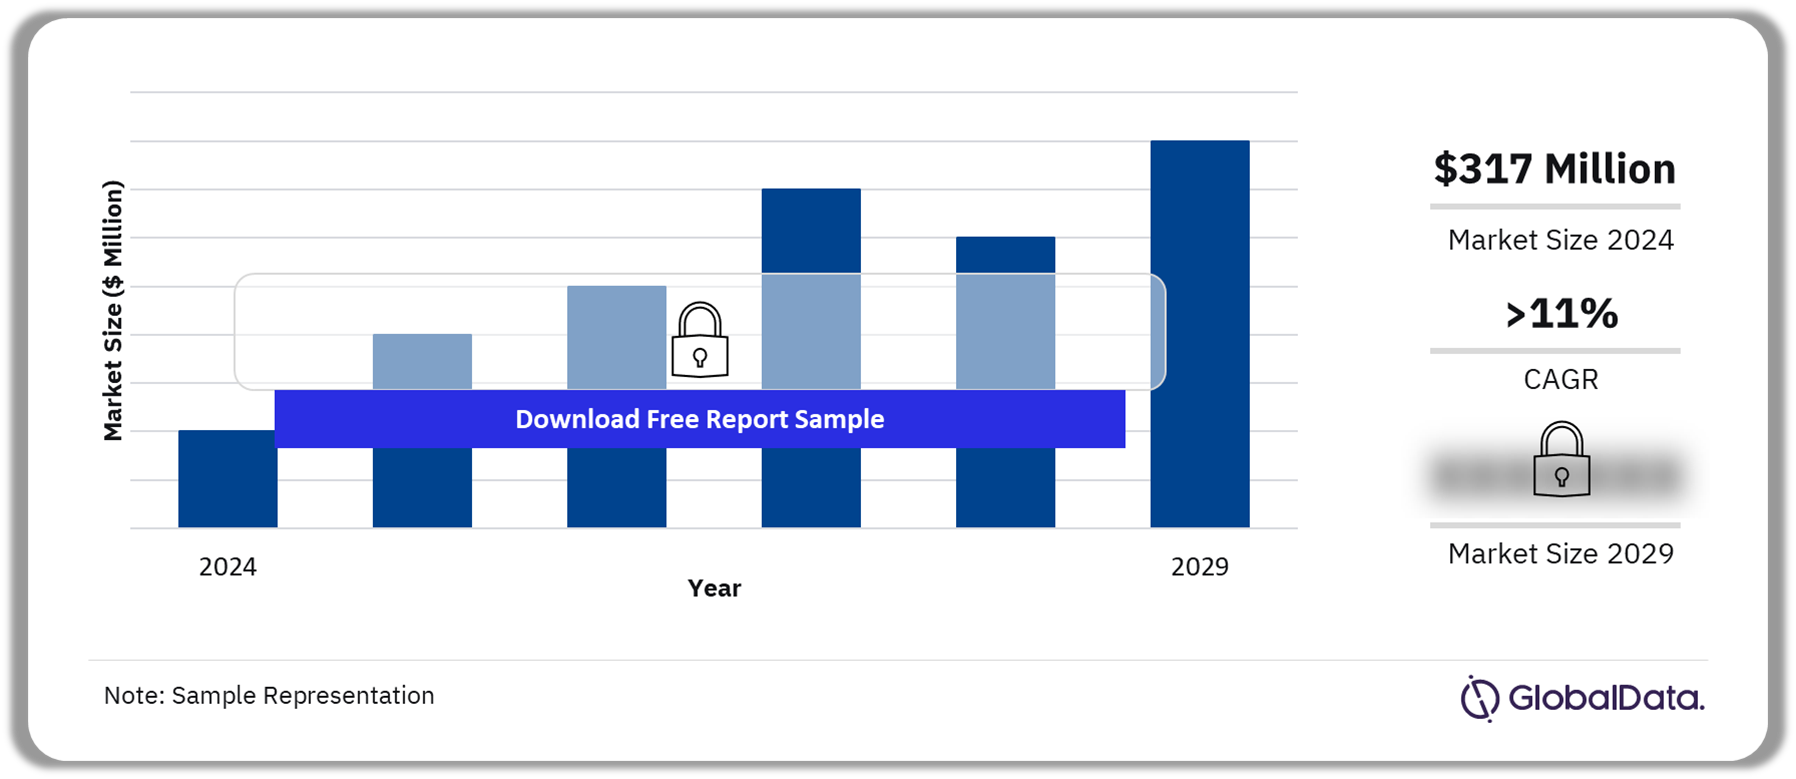
As of 2024, the Ghana defense budget is worth $317 million. The country’s defense budget is expected to grow at a CAGR of more than 11% during 2025-2029. The need to mitigate the escalation in regional instability in the Sahel region is the major factor driving Ghana’s defense expenditure. Additionally, the increasing threat of piracy in the Gulf of Guinea poses a major risk to the maritime trade and compels Ghana to enhance patrolling in the region.

Ghana Defense Market Outlook, 2024-2029 ($ Million)

Ghana Defense Market Outlook, 2024-2029 ($ Million)

Buy the Full Report for More Insights into the Ghana Defense Market Forecast

Download a Free Report Sample

The Ghana defense market research report provides the market size forecast and the projected growth rate for the next five years. Furthermore, our analysts have carried out a comprehensive industry analysis to determine key market drivers, emerging technology trends, key sectors, and major challenges faced by market participants, in this report. The Ghana defense market study has also assessed key factors and government programs that are expected to influence the demand for military platforms over the forecast period.

Market Size (2024) $317 million
CAGR (2025-2029) >11%
Forecast Period 2025-2029
Historical Period 2020-2024
Key Drivers ·        Instability in the Sahel Region

·        Piracy in the Gulf of Guinea

Key Sectors ·        Military Fixed Wing Aircraft

·        Military Land Vehicles

·        Tactical Communication Systems

·        Naval Vessels and Surface Combatants

·        Military Unmanned Aerial Vehicles

Leading Companies ·        AERO Vodochody AEROSPACE a.s.

·        Embraer SA

·        Elbit Systems Ltd

·        IVECO Defence Vehicles Spa

·        Ukrspecsystems LLC

Enquire & Decide Discover the perfect solution for your business needs. Enquire now and let us help you make an informed decision before making a purchase.

Ghana Defense Market Drivers

The key factors driving the Ghana defense market growth are instability in the Sahel region and piracy in the Gulf of Guinea.

Instability in the Sahel Region: The increasing level of political instability and volatility in the Sahel region offers fertile ground for the growth of radicalism and extremism. This compels Ghana to enhance the country’s security and defense posture. 

Buy the Full Report for Additional Information on the Ghana Defense Market Drivers

Download a Free Report Sample

Ghana Military Doctrines and Defense Strategies

A vast majority of the functions of Ghana’s Armed Forces are symbolic in nature. These functions exist to emphasize the control of the civil executive over the military and are led by the democratically elected incumbent government, which retains control over the state.

The increasing radicalization in the neighborhood has compelled Ghana to evolve a comprehensive strategy to tackle terrorism. As a part of the strategy, Ghana has organized training to enhance inter-agency collaboration as well as the sharing of information between different law enforcement agencies in Ghana’s five regions.

Buy the Full Report for More Insights on the Military Doctrines and Defense Strategies in the Ghana Defense Market

Download a Free Report Sample

Ghana Defense Market Segmentation by Sectors

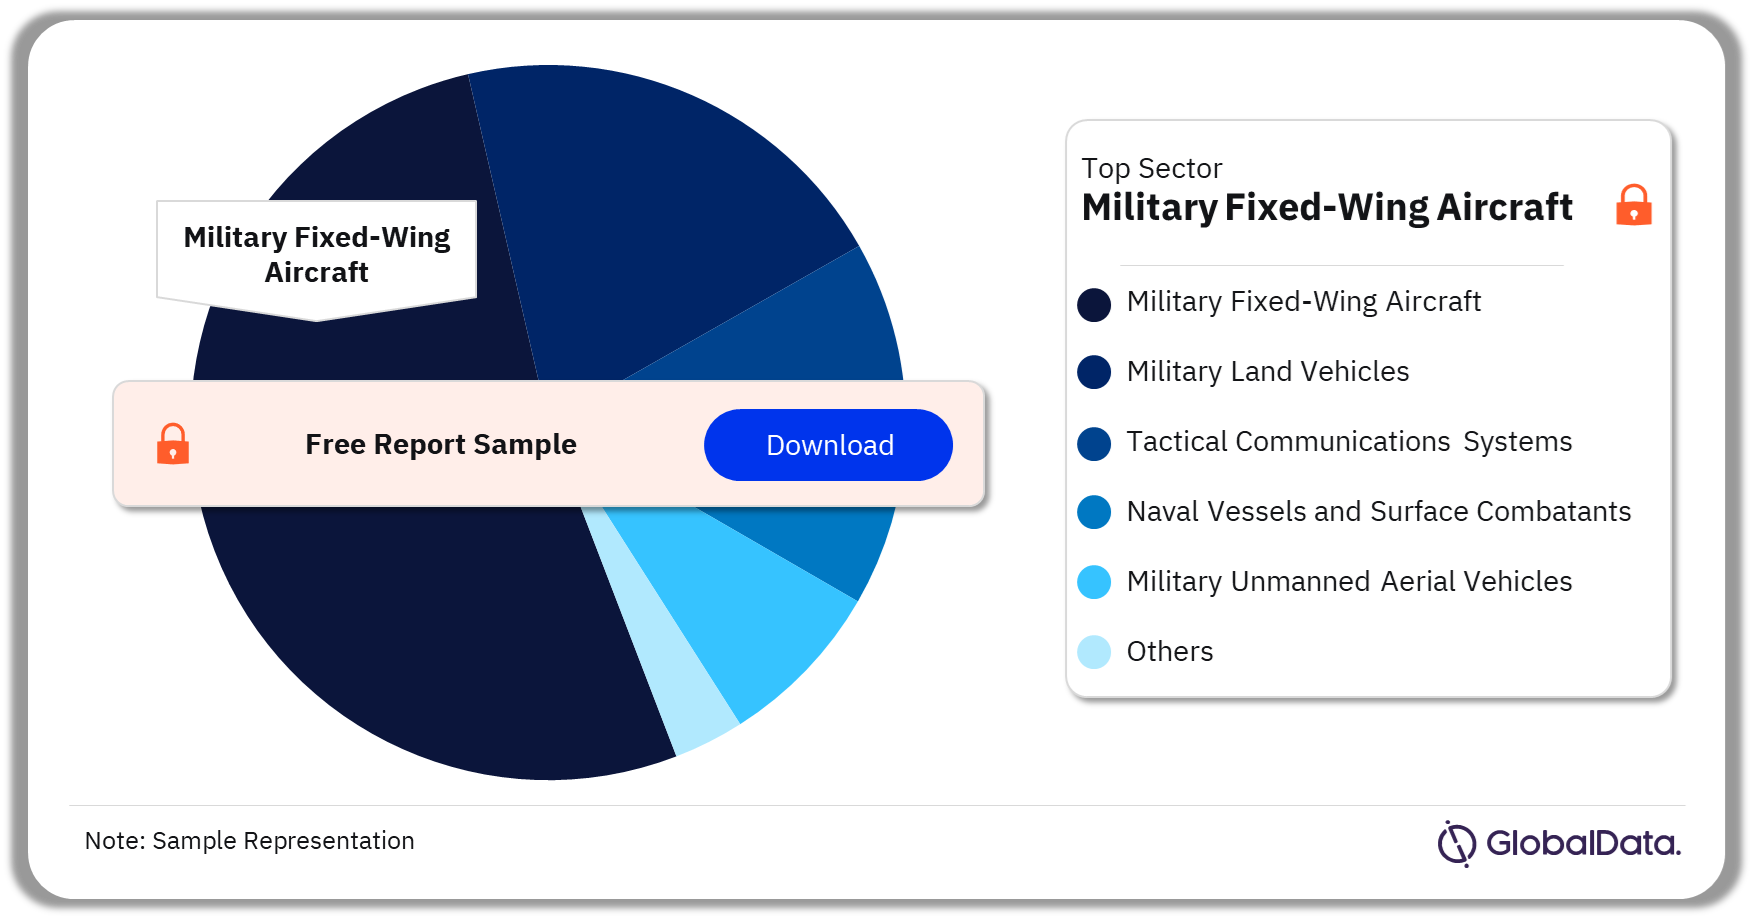
The key sectors in the Ghana defense market are military fixed-wing aircraft, military land vehicles, tactical communication systems, naval vessels and surface combatants, and military unmanned aerial vehicles, among others. In 2024, the most attractive sector in Ghana’s defense market is military fixed-wing aircraft, followed by military land vehicles. The military fixed-wing aircraft segment is predicted to be the single largest sector in Ghana’s defense market between 2024 and 2026.

Ghana Defense Market Analysis by Sectors, 2024 (%)

Ghana Defense Market Analysis by Sectors, 2024 (%)

Buy the Full Report for More Sector Insights into the Ghana Defense Market

Download a Free Report Sample

Ghana Defense Market - Competitive Landscape

A few of the leading defense companies operating in Ghana are:

  • AERO Vodochody AEROSPACE a.s.
  • Embraer SA
  • Elbit Systems Ltd
  • IVECO Defence Vehicles Spa
  • Ukrspecsystems LLC

AERO Vodochody AEROSPACE a.s. (Aero), headquartered in Odolena Voda, the Czech Republic, is a manufacturer of aerostructures for military and commercial aircraft programs. The company collaborates with leading aerospace manufacturers in international aerostructures programs such as Rotorcraft, and C series. It provides whole aircraft development, rotorcraft assembly, landing gears, and major component assemblies for its customers.

Ghana Defense Market Analysis by Companies

Ghana Defense Market Analysis by Companies

Buy the Full Report for More Company Insights into the Ghana Defense Market

Download a Free Report Sample

Segments Covered in the Report

Ghana Defense Market Sectors Outlook (Value, $ Million, 2020-2029)

  • Military Fixed Wing Aircraft
  • Military Land Vehicles
  • Tactical Communication Systems
  • Naval Vessels and Surface Combatants
  • Military Unmanned Aerial Vehicles

Scope

The report provides:

  • Detailed analysis of the Ghana 2023 defense budget broken down into market size and market share.
  • Overview of key current and future acquisitions.
  • Explanation of the procurement policy and process.
  • Analysis of Ghana’s military doctrine and strategy to provide a comprehensive overview of Ghana’s military procurement regulation.
  • Outline of political alliances and perceived security threats to Ghana and trends in spending and modernization.
  • Analysis of the competitive landscape and strategic insights of Ghana’s defense industry.

Key Highlights

• Ghana’s defense budget was $317 million in 2024 and registered a decline of 3.5% over the historic period 2020–2024. However, the defense budget declined from $343.9 million in 2023, registering a negative annual growth of 7.8% in 2024. Over the forecast period, Ghana’s defense expenditure is anticipated to register a CAGR of 11.3% over 2025–29 and reach $509.6 million by 2029.

• Ghana is expected to offer a decent market for defense suppliers. Sectors such as military fixed-wing, military land vehicles, and tactical communication Systems rank among the leading sectors in the Ghana defense market.

Reasons to Buy

  • Determine prospective investment areas based on a detailed trend analysis of the Ghana defense market over the next five years.
  • Understand the underlying factors driving demand for different defense and internal security segments in the Ghana market and identify the opportunities offered.
  • Strengthen your understanding of the market in terms of demand drivers, market trends, and the latest technological developments, among others.
  • Identify the major threats that are driving the Ghana defense market providing a clear picture of future opportunities that can be tapped, resulting in revenue expansion.
  • Channel resources by focusing on the ongoing programs that are being undertaken by the Ghana government.
  • Make correct business decisions based on an in-depth analysis of the competitive landscape consisting of detailed profiles of the top defense equipment providers in the country. The company profiles also include information about the key products, alliances, recent contracts awarded, and financial analysis, wherever available.

AERO Vodochody AEROSPACE a.s.

Table of Contents

  • 1. Executive Summary
  • 2. Defense Budget Assessment

    • 2.1. Budgeting Process
    • 2.2. Defense Market Size Historic and Forecast
    • 2.3. Drivers Of Defense Expenditure
    • 2.4. Analysis of Defense Expenditure Allocation
    • 2.5. Analysis Of Defense Budget Allocation

  • 3. Military Doctrine and Security Environment

    • 3.1. Military Doctrine and Strategy
    • 3.2. Strategic Alliances and Geopolitics
    • 3.3. Political, Social and Economic Scenario

  • 4. Market Entry Strategy and Regulations

    • 4.1. Defense Procurement Bodies
    • 4.2. Defence Procurement Policy and Market Regulations
    • 4.3. Market Entry Routes
    • 4.4. Key Challenges

  • 5. Market Attractiveness and Emerging Opportunities

    • 5.1. Market Attractiveness by Defense Sector
    • 5.2. Top Defense Segments by Value

  • 6. Defense Platform Acquisitions

    • 6.1. Defense Platform Acquisitions By Value
    • 6.2. L-39NG

  • 7. Fleet Size

    • 7.1. Army
    • 7.2. Air Force
    • 7.3. Navy

  • 8. Competitive Landscape

    • 8.1. Defense Companies Operating in Ghana
    • 8.2. Main Defense Companies

  • 9. Appendix

    • 9.1. About This Report
    • 9.2. About Us
    • 9.3. Contact Us

Table

List of Tables

Table 1: Ghana Army Strength

Table 2: Ghana Airforce Strength

Table 3: Ghana Navy Strength

Table 4: Ghana – Ongoing Development and Procurement Programs

Table 5: Ghana – Future Procurement Programs

Table 6: Ghanaian Defense Expenditure (GHS Million & US$ Million), 2015-2024

Table 7: Ghanaian GDP Growth vs. Defense Expenditure as Percentage of GDP Growth, 2015-2024

Table 8: Ghanaian Defense Budget Split between Capital and Revenue Expenditure (%), 2015-2024

Table 9: Ghanaian Defense Capital Expenditure (GHS Million & US$ Million), 2015-2024

Table 10: Ghanaian Per-Capita Defense Expenditure (US$), 2015-2024

Table 11: Ghanaian Homeland Security Expenditure (GHS Billion & US$ Million), 2015-2024

Table 12: Benchmarking with Key Markets – 2015-2019 vs. 2020-2024

Table 13: Top 10 Ghanaian Defense Market Sectors by Value (US$ Million) – 2019-2024

Table 14: Competitive Landscape of the Ghanaian Defense Industry

Figures

List of Figures

Figure 1: Ghana Defense Budget: 2020 and 2024

Figure 2 : Ghana Defense Imports/Exports: 2013 and 2017

Figure 3 : Ghana’s Prospective Procurements/Developments

Figure 4: Key Challenges in Ghana’s Defense Market

Figure 5: Ghanaian Defense Expenditure (in GHS Billion), 2015-2024

Figure 6: Ghanaian Defense Expenditure (in US$ Million), 2015-2024

Figure 7: Ghanaian GDP Growth vs. Defense Expenditure as Percentage of GDP Growth, 2015-2024

Figure 8: Ghanaian Defense Budget Split Between Capital and Revenue Expenditure (%), 2015-2024

Figure 9: Ghanaian Capital Budget Allocation (GHS Million), 2015-2024

Figure 10: Ghanaian Capital Budget Allocation (US$ Million), 2015-2024

Figure 11:Ghanaian Per-Capita Defense Expenditure (US$), 2015-2024

Figure 12: Ghanaian Homeland Security Budget (GHS Billion), 2015-2024

Figure 13: Ghanaian Homeland Security Budget (US$ Million), 2015-2024

Figure 14: Benchmarking with Key Markets – 2015-2019 vs. 2020-2024

Figure 15: Defense Expenditure of the World’s Largest Military Spenders (US$ Billion), 2019 and 2024

Figure 16: Defense Expenditure as a Percentage of GDP of Largest Military Spenders (%), 2019

Figure 17: Ghanaian Defense Import Trend, 2013-2017 (TIV values)

Figure 18: Ghanaian Defense Imports by Country (US$ Million), 2013-2017

Figure 19: Ghanaian Defense Imports by Weapon Category (%), 2013-2017

Figure 20: Ghana Budgeting Process

Figure 21: Ghana’s GDP per capita (US$), 2015-2025

Figure 22: Ghana’s Gross Domestic Product (current US$ Billion), 2015-2025

Figure 23: Ghana’s Exports of goods and services (LCU Billion), 2005-2014

Figure 24: Ghana’s Imports of goods and services (LCU Billion), 2005-2014

Figure 25: Ghana’s LCU per US$, 2015-2024

Figure 26: Ghana’s Market capitalization of listed companies (US$ Billion), 2005-2012

Figure 27: Ghana’s Market capitalization of listed companies (% GDP), 2005-2012

Figure 28: Ghanaian Government cash surplus/deficit as a % of GDP (LCU), 2005-2011

Figure 29: Ghana’s Goods Exports as a % of GDP, 2005-2013

Figure 30: Ghana’s Goods Imports as a % of GDP, 2005-2013

Figure 31: Ghana’s Services Imports as a % of GDP, 2005-2013

Figure 32: Ghana’s Net Foreign Direct Investment (BoP, current US$ Billion), 2005-2013

Figure 33: Ghana’s Services Exports as a % of GDP, 2005-2013

Figure 34: Ghana’s Net FDI as a percentage of GDP, 2005-2013

Figure 35: Ghana’s Mining, Manufacturing, Utilities Output (LCU Billion) 2005-2014

Frequently asked questions

Ghana Defense Market Size, Trends, Budget Allocation, Regulations, Acquisitions, Competitive Landscape and Forecast to 2029 standard reports
Currency USD
$1,250

Can be used by individual purchaser only

$2,500

Can be shared globally by unlimited users within the purchasing corporation e.g. all employees of a single company


Undecided about purchasing this report?

Enquire Before Buying Request a Free Sample

Get in touch to find out about multi-purchase discounts

reportstore@globaldata.com
Tel +44 20 7947 2745

Every customer’s requirement is unique. With over 220,000 construction projects tracked, we can create a tailored dataset for you based on the types of projects you are looking for. Please get in touch with your specific requirements and we can send you a quote.

Sample Report

Ghana Defense Market Size, Trends, Budget Allocation, Regulations, Acquisitions, Competitive Landscape and Forecast to 2029 was curated by the best experts in the industry and we are confident about its unique quality. However, we want you to make the most beneficial decision for your business, so we offer free sample pages to help you:

  • Assess the relevance of the report
  • Evaluate the quality of the report
  • Justify the cost

Download your copy of the sample report and make an informed decision about whether the full report will provide you with the insights and information you need.

Below is a sample report to understand what you are buying

See what our customers are saying

“The GlobalData platform is our go-to tool for intelligence services. GlobalData provides an easy way to access comprehensive intelligence data around multiple sectors, which essentially makes it a one-for-all intelligence platform, for tendering and approaching customers.

GlobalData is very customer orientated, with a high degree of personalised services, which benefits everyday use. The highly detailed project intelligence and forecast reports can be utilised across multiple departments and workflow scopes, from operational to strategic level, and often support strategic decisions. GlobalData Analytics and visualisation solutions has contributed positively when preparing management presentations and strategic papers.”

Business Intelligence & Marketing Manager, SAL Heavy Lift

“COVID-19 has caused significant interference to our business and the COVID-19 intelligence from GlobalData has helped us reach better decisions around strategy. These two highlights have helped enormously to understand the projections into the future concerning our business units, we also utilise the project database to source new projects for Liebherr-Werk to use as an additional source to pitch for new business.”

Market Analyst & Management, Liebherr-Werk

Your daily news has saved me a lot of time and keeps me up-to-date with what is happening in the market, I like that you almost always have a link to the source origin. We also use your market data in our Strategic Business Process to support our business decisions. By having everything in one place on the Intelligence Center it has saved me a lot of time versus looking on different sources, the alert function also helps with this.

Head of Key Accounts, Saab AB

Having used several other market research companies, I find that GlobalData manages to provide that ‘difficult-to-get’ market data that others can’t, as well as very diverse and complete consumer surveys.

Marketing Intelligence Manager, Portugal Foods

Our experience with GlobalData has been very good, from the platform itself to the people. I find that the analysts and the account team have a high level of customer focus and responsiveness and therefore I can always rely on. The platform is more holistic than other providers. It is convenient and almost like a one stop shop. The pricing suite is highly competitive and value for our organisation.

I like reports that inform new segments such as the analysis on generation Z, millennials, the impact of COVID 19 to our banking customers and their new channel habits. Secondly the specialist insight on affluent sector significantly increases our understanding about this group of customers. The combination of those give us depth and breadth of the evolving market.

I’m in the business of answering and helping people make decisions so with the intelligence center I can do that, effectively and efficiently. I can share quickly key insights that answer and satisfy our country stakeholders by giving them many quality studies and primary research about competitive landscape beyond the outlook of our bank. It helps me be seen as an advisory partner and that makes a big difference. A big benefit of our subscription is that no one holds the whole data and because it allows so many people, so many different parts of our organisation have access, it enables all teams to have the same level of knowledge and decision support.

Head of Customer Insight and Research, Standard Chartered

“I know that I can always rely on Globaldata’s work when I’m searching for the right consumer and market insights. I use Globaldata insights to understand the changing market & consumer landscape and help create better taste & wellbeing solutions for our customers in food, beverage and healthcare industries.

Globaldata has the right data and the reports are of very high quality compared to your competitors. Globaldata not only has overall market sizes & consumer insights on food & beverages but also provides insights at the ingredient & flavour level. That is key for B2B companies like Givaudan. This way we understand our customers’ business and also gain insight to our unique industry”

Head of Consumer Sensory Insights, Givaudan

GlobalData provides a great range of information and reports on various sectors that is highly relevant, timely, easy to access and utilise.  The reports and data dashboards help engagement with clients; they provide valuable industry and market insights that can enrich client conversations and can help in the shaping of value propositions. Moreover, using GlobalData products has helped increase my knowledge of the finance sector, the players within it, and the general threats and opportunities.

I find the consumer surveys that are carried out to be extremely beneficial and not something I have seen anywhere else. They provided an insightful view of why and which consumers take (or don’t) particular financial products. This can help shape conversations with clients to ensure they make the right strategic decisions for their business.

One of the challenges I have found is that data in the payments space is often piecemeal. With GD all of the data I need is in one place, but it also comes with additional market reports that provide useful extra context and information. Having the ability to set-up alerts on relevant movements in the industry, be it competitors or customers, and have them emailed directly to me, ensures I get early sight of industry activity and don’t have to search for news.

Senior Account Manager, TSYS
Go even deeper with GlobalData Intelligence Center

Every Company Report we produce is powered by the GlobalData Intelligence Center.

Subscribing to our intelligence platform means you can monitor developments at Ghana Defense Market Size, Trends, Budget Allocation, Regulations, Acquisitions, Competitive Landscape and Forecast to 2029 in real time.

  • Access a live Ghana Defense Market Size, Trends, Budget Allocation, Regulations, Acquisitions, Competitive Landscape and Forecast to 2029 dashboard for 12 months, with up-to-the-minute insights.
  • Fuel your decision making with real-time deal coverage and media activity.
  • Turn insights on financials, deals, products and pipelines into powerful agents of commercial advantage.