Industrial Minerals Market Size, Share, Trends and Analysis by Region, Commodity, End-Use and Segment Forecast to 2030

Powered by

Access in-depth insight and stay ahead of the market

Accessing the in-depth insight from the ‘Industrial Minerals’ report can help you:

  • Analyze the market size with a breakdown provided by 14 commodities, key end-uses, and regions/countries
  • Map the primary features of the value chain and key stakeholders involved within it
  • Evaluate potential growth opportunities in different commodity and end-use segments supported by comprehensive qualitative commentary
  • Foresee possible changing dynamics of the sector and align business strategies to capitalize on them
  • List of major active and upcoming mining projects

How is our Industrial Minerals’ report different from other reports in the market?

  • The report presents a holistic view of the market in terms of demand while highlighting market segmentation based on commodity, end-use, and region from 2020 to 2030 in terms of volume (Thousand Tonnes)
  • Detailed segmentation by commodity – Barite, Bentonite, Boron, Diatomite, Dolomite, Feldspar, Fluorspar, Graphite, Gypsum and Anhydrite, Kaolin, Limestone, Phosphate Rock, Potash, and Salt
  • The report highlights segmentation at end-use level – Construction & Material, Chemical, Ceramic & Glass, and Others
  • The report depicts a brief overview of the technological trends of the sector. In addition, key variables influencing the market growth over the forecast period are analyzed to present a detailed outlay of the market conditions.
  • The regional section of the study is further bifurcated at a country level covering key trends, activities, end-use updates, companies, and demand projections.
  • Competitive landscape of the market provides a compressive overview of the value chain capturing key developments and their impact on the industry, company ranking analysis, and list of equipment suppliers.
  • Detailed company profiles for key vendors of the market with a focus on business overview, financial performance, product benchmarking, and strategic initiatives.

We recommend this valuable source of information to anyone involved in:

  • Mining/Construction/Chemical/Glass/Ceramic Companies
  • Mining Equipment and Plant Suppliers
  • Engineering and Construction Contractors
  • Consultants and Analysts
  • Equity Partners
  • Venture Capital Firms

To Get a Snapshot of the Industrial Minerals Market Report, Download a Free Report Sample

Industrial Minerals Market Overview

The industrial minerals market volumetric demand is projected to reach 2,377.7 million tonnes in 2023, registering a compounded annual growth rate (CAGR) of 2.8% from 2023 to 2030. The expansion in the global construction sector especially surrounding infrastructural development is projected to drive market growth over the forecast period.

Industrial minerals consumption patterns are primarily dependent on the movement of the global construction sector owing to its primary share in 2022 within the global volumetric demand. In 2023, the sluggish growth of the global construction sector is expected primarily due to the downturns across advanced economies. However, the momentum is expected to pick up in 2024 with an annual average growth rate (AAGR) estimated at 3.9% from 2024 to 2027.

Industrial Minerals Market Outlook, 2020-2030 (Million Tonnes)

Industrial Minerals Market Outlook, 2020-2030 (Million Tonnes)

View Sample Report for Additional Insights on Industrial Minerals Market Forecast, Download a Free Report Sample

The industrial minerals market expanded by 1.1% in 2022 backed by the growth in demand from the construction and chemical sectors. During this same time period, the global construction sector rose by 2.1% in real terms and the chemical sector observed an uptick of 2.3%. Although, in 2023, the construction industry growth is expected to remain sluggish, including China, the global industry will expand by just 0.8%, and excluding China the industry is predicted to contract by 0.1%. The gloomy outlook reflects the weak economic backdrop, and additional challenges specific to the global construction industry, notably high construction material costs and labor shortages.

Moreover, in the chemical sector as well, marginal deceleration is predicted in 2023 owing to the weak economic conditions across developed economies. In addition, the changing geopolitical dynamics especially related to oil and gas trade around the globe are likely to further hamper the confidence levels of the market participants over the short-term period.

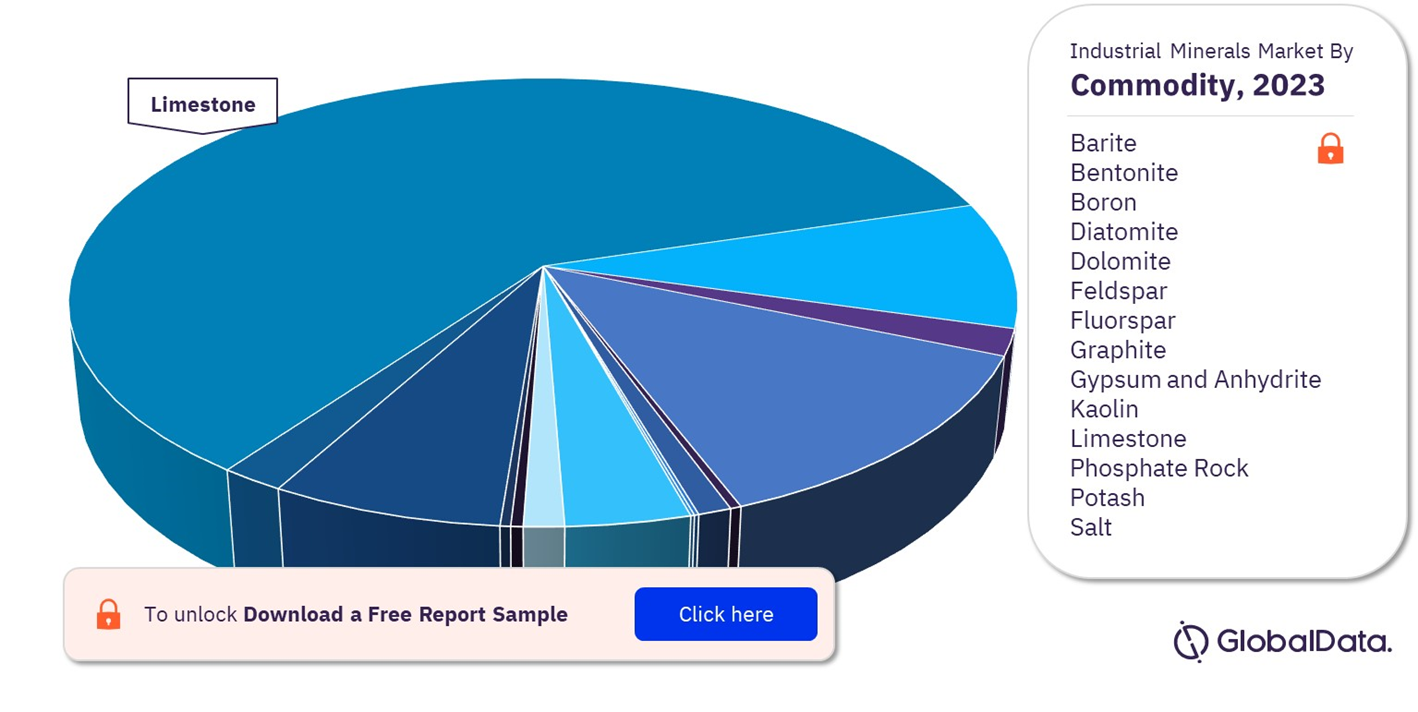
Industrial Minerals Market Segmentation by Commodity

The commodity segment comprises 14 minerals including barite, bentonite, boron, diatomite, dolomite, feldspar, fluorspar, graphite, gypsum and anhydrite, kaolin, limestone, phosphate rock, potash, and salt. Among these aforementioned categories, the limestone section is estimated to dominate the volumetric demand in 2023. The limestone segment will remain the dominant segment over the forecast period with marginal share loss expected by 2030.

Industrial Minerals Market Share by Commodity, 2023 (%)

Industrial Minerals Market Share by Commodity, 2023 (%)

Fetch sample PDF for Segment-Specific Revenues and Shares, Download a Free Report Sample

The second largest segment within the commodity category is salt in 2023. The use of this commodity for deicing purposes coupled with its usage in the chemical manufacturing vertical is anticipated to drive the segmental growth over the forecast period.

The phosphate rock category is poised to become the third-largest commodity category in 2023. However, this segment is predicted to expand at a low compounded annual growth rate of 1.4% from 2023 to 2030. The primary reason for this sluggish growth is the disruption of the supply chain, ongoing geo-political conflicts, and the increasing popularity of natural way of farming.

The usage of gypsum and anhydrite minerals in processed and unprocessed forms especially in the construction sector is directly aiding the segmental growth over the past few years. This trend is likely to continue with the predicted recovery of the construction sector in 2024.

Dolomite is the next category accounting for a single digit share in the global market space in 2023 This mineral expanded at 1.1% in 2023 as compared to the previous year, primarily boosted by steady demand from the construction vertical.

Industrial Minerals Market Segmentation by End-Use

The end-use category of the industrial minerals market comprises of construction & material, chemical, ceramic & glass, and others. Among these end-use segments, the construction & material vertical is anticipated to capture the largest volumetric share in 2023. The average consumption of industrial minerals within the construction & material end-use sector is the highest as compared to its counterparts. For instance, as per the stats published by the European Union, an average house comprises more than 150 tonnes of industrial minerals. This trend is anticipated to progress further with the increasing emphasis on climate-friendly materials for construction.

Industrial Minerals Market Share by End-Use, 2023 (%)

Industrial Minerals Market Share by End-Use, 2023 (%)

Industrial Minerals Market Outlook Report with Detailed Segment Analysis is Available with GlobalData Now! Download a Free Report Sample

The chemical segment accounted for a generous global volumetric demand share in 2023. The usage of the commodity in the manufacturing of different base chemicals, agrochemicals, retardants, absorbents, paints & coatings, adhesives & sealants, among others is likely to drive the segmental growth over the forecast period.

The ceramic & glass category directly or indirectly employs the usage of industrial minerals in processed or unprocessed forms. The segment is predicted to grow at a stable compounded annual growth rate of 2.4% in terms of volume from 2023 to 2030. The rising prominence of glass wall facades in commercial spaces is expected to positively aid segmental growth over the forecast period.

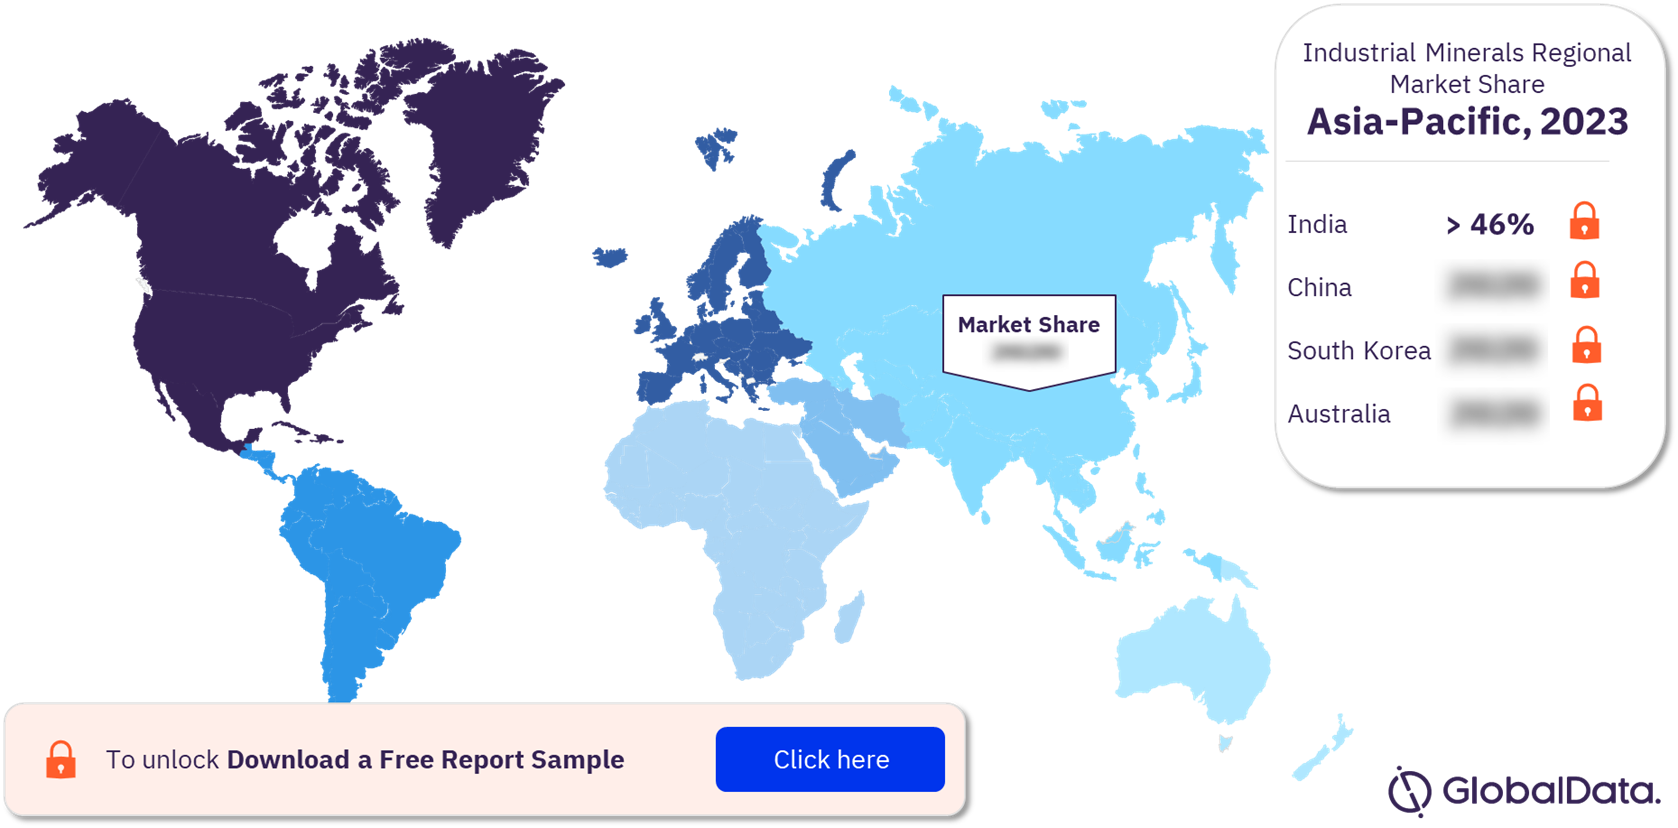
Industrial Minerals Market Analysis by Region

The Asia Pacific region registered a majority of global volumetric demand share in 2023. The regional growth prospects showcase strong consumption rate for these commodities particularly in the construction vertical. The region is the largest construction sector in the world and thus, the movement of this vertical is anticipated to directly deliver the growth for the industrial minerals market over the forecast period.

China, India, Australia, and South Korea are among the leading countries in the Asia Pacific region. These four countries have a combined three-fourth of the regional share in 2023. Among these, India is estimated to remain the key center of demand for industrial minerals over the forecast period owing to the rapidly expanding domestic construction sector.

Asia-Pacific Industrial Minerals Market Share by Country, 2023 (%)

Asia-Pacific Industrial Minerals Market Share by Country, 2023 (%)

View Sample Report for Additional Industrial Minerals Market Insights, Download a Free Report Sample

North America is poised to remain the second largest region in 2023. The regional demand traits are widely influenced by the US owing to its significant regional share in terms of volume over the aforementioned timeline. The US construction activities are predicted to register sluggish growth in 2023 owing rise in construction costs, interest rates, and cost of living.

The Europe region is expected to expand at a slowest compounded annual growth rate (CAGR) of 1.1% from 2023 to 2030. The primary reason for this stagnant growth is the ongoing conflict between Russia and Ukraine which has directly increased the energy cost in the region coupled with a disrupted supply of ceramic minerals. Ukraine is considered a key source of ceramic minerals and an important trade partner for the ceramic industries of Spain, Turkey, Italy, and others. The ongoing conflict has upset the confidence level of the ceramic vendors leading to a price war to secure the commodity supply.

The Middle East & Africa region is predicted to register the second-highest compounded annual growth rate of 2.9% over the forecast period. The regional dynamics are anticipated to be supported by the GCC construction vertical. The arrival and launching of new mega projects in the region are likely to generate stable demand for industrial minerals over the forecast period.

Central & South America is the smallest regional market with primary demand generated from Brazil. However, the economic slowdown in Brazil and remaining regional countries with rising inflation costs is expected to remain a key restraint for the growth of industrial minerals over the forecast period.

Industrial Minerals Market – Competitive Landscape

The industrial minerals market is highly competitive especially at the regional level. The low cost and high volume of this commodity often restraint its trade movement and directly promotes the usage of local minerals. However, the majority of the vendors present in this market are integrated from mining operations to manufacturing of finished product used across different end-use verticals.

The industrial minerals world is observing market consolidation at a regional level. For instance, in October 2022, KaMin LLC a renowned vendor that mines, manufactures, and distributes a wide variety of minerals and related solutions acquired BASF’s kaolin business segment in the US. The acquisition includes four production sites, two processing facilities, and mines.

Leading Players in the Industrial Minerals Market

  • The Mosaic Co
  • Yara International ASA
  • Israel Corporation Ltd
  • Saudi Arabian Mining Co
  • Nutrien Ltd
  • Holcim Ltd
  • CRH Plc
  • Vulcan Materials Co
  • UltraTech Cement Ltd
  • CEMEX SAB de CV
  • Imerys SA
  • K+S AG
  • SCR-Sibelco NV
  • Compagnie de Saint-Gobain
  • Syrah Resources Ltd

Other Industrial Minerals Market Vendors Mentioned

WA Kaolin Ltd, Thiele Kaolin Company, KaMin LLC, Gypsum Resources Materials, Ashapura Group, Quarzwerke GmbH, Boral Ltd, Knauf Group, and many more.

To Know More About Leading Industrial Minerals Market Players, Download a Free Report Sample

Industrial Minerals Market Research Scope

Market Size in 2023 2,377.7 Million Tonnes
Market Size in 2030 2,909.8 Million Tonnes
CAGR 2.8% from 2023 to 2030
Forecast Period 2023-2030
Historic Data 2020 – 2022
Report Scope & Coverage Industry overview, volume forecast, regional analysis, competitive landscape, company profiles, growth trends
Commodity Segment Barite, Bentonite, Boron, Diatomite, Dolomite, Feldspar, Fluorspar, Graphite, Gypsum And Anhydrite, Kaolin, Limestone, Phosphate Rock, Potash, and Salt
End-Use Segment Construction & Material, Chemical, Ceramic & Glass, and Others
Regional Segment North America, Europe, Asia Pacific, Central & South America, and Middle East & Africa
Country Segment US, Canada, Germany, France, UK, Spain, Russia, China, India, Australia, South Korea, Brazil, Saudi Arabia, South Africa
Key Companies The Mosaic Co, Yara International ASA, Israel Corporation Ltd, Saudi Arabian Mining Co, Nutrien Ltd, Holcim Ltd, CRH Plc, Vulcan Materials Co, UltraTech Cement Ltd, CEMEX SAB de CV, Imerys SA, K+S AG, SCR-Sibelco NV, Compagnie de Saint-Gobain, Syrah Resources Ltd

Industrial Minerals Market Segments and Scope

GlobalData Plc has segmented the industrial minerals market report by commodity, end-use, and region:

Industrial Minerals Commodity Outlook (Volume, Thousand Tonnes, 2020-2030)

  • Barite
  • Bentonite
  • Boron
  • Diatomite
  • Dolomite
  • Feldspar
  • Fluorspar
  • Graphite
  • Gypsum and Anhydrite
  • Kaolin
  • Limestone
  • Phosphate Rock
  • Potash
  • Salt

Industrial Minerals End-Use Outlook (Volume, Thousand Tonnes, 2020-2030)

  • Construction & Material
  • Chemical
  • Ceramic & Glass
  • Others

Industrial Minerals Regional Outlook (Volume, Thousand Tonnes, 2020-2030)

  • North America
  • US
  • Canada
  • Europe
  • Germany
  • France
  • UK
  • Spain
  • Russia
  • Rest of Europe
  • Asia-Pacific
  • China
  • India
  • Australia
  • South Korea
  • Rest of Asia Pacific
  • Central & South America
  • Brazil
  • Rest of Central & South America
  • Middle East & Africa
  • Saudi Arabia
  • South Africa
  • Rest of Middle East & Africa

Table of Contents

Chapter 1 Executive Summary

Chapter 2 Research Scope and Segmentation

Chapter 3 Market Overview

Chapter 4 Industrial Minerals – Industry Trend Analysis

4.1 Macroeconomic Indicators

4.2 Value Chain Analysis

4.3 Industrial Minerals – Market Drivers

4.4 Industrial Minerals – Market Restraints

4.5 Industrial Minerals – Market Opportunities

4.6 Technological Trends

4.7 Industrial Mineral Production Outlook

4.8 Industrial Mineral Trade Outlook

4.9 Industrial Minerals – Mergers & Acquisitions

5.0 List of 20 Upcoming Mines

Chapter 5 Industrial Minerals Segment Outlook

5.1 Global Market Volume Snapshot

5.2 Global Industrial Minerals Market by Commodity

5.2.1 Barite

5.2.1.1 Global Industrial Minerals Market Estimates and Forecasts, by Barite, 2020-2030 (Thousand Tonnes)

5.2.2 Bentonite

5.2.2.1 Global Industrial Minerals Market Estimates and Forecasts, by Bentonite, 2020-2030 (Thousand Tonnes)

5.2.3 Boron

5.2.3.1 Global Industrial Minerals Market Estimates and Forecasts, by Boron, 2020-2030 (Thousand Tonnes)

5.2.4 Diatomite

5.2.4.1 Global Industrial Minerals Market Estimates and Forecasts, by Diatomite, 2020-2030 (Thousand Tonnes)

5.2.5 Dolomite

5.2.5.1 Global Industrial Minerals Market Estimates and Forecasts, by Dolomite, 2020-2030 (Thousand Tonnes)

5.2.6 Feldspar

5.2.6.1 Global Industrial Minerals Market Estimates and Forecasts, by Feldspar, 2020-2030 (Thousand Tonnes)

5.2.7 Fluorspar

5.2.7.1 Global Industrial Minerals Market Estimates and Forecasts, by Fluorspar, 2020-2030 (Thousand Tonnes)

5.2.8 Graphite

5.2.8.1 Global Industrial Minerals Market Estimates and Forecasts, by Graphite, 2020-2030 (Thousand Tonnes)

5.2.9 Gypsum and Anhydrite

5.2.9.1 Global Industrial Minerals Market Estimates and Forecasts, by Gypsum and Anhydrite, 2020-2030 (Thousand Tonnes)

5.2.10 Kaolin

5.2.10.1 Global Industrial Minerals Market Estimates and Forecasts, by Kaolin, 2020-2030 (Thousand Tonnes)

5.2.11 Limestone

5.2.11.1 Global Industrial Minerals Market Estimates and Forecasts, by Limestone, 2020-2030 (Thousand Tonnes)

5.2.12 Phosphate Rock

5.2.12.1 Global Industrial Minerals Market Estimates and Forecasts, by Phosphate Rock, 2020-2030 (Thousand Tonnes)

5.2.13 Potash

5.2.13.1 Global Industrial Minerals Market Estimates and Forecasts, by Potash, 2020-2030 (Thousand Tonnes)

5.2.14 Salt

5.2.14.1 Global Industrial Minerals Market Estimates and Forecasts, by Salt, 2020-2030 (Thousand Tonnes)

5.3 Global Industrial Minerals Market by End-Use

5.3.1 Construction & Material

5.3.1.1 Global Industrial Minerals Market Estimates and Forecasts, by Construction & Material, 2020-2030 (Thousand Tonnes)

5.3.2 Chemical

5.3.2.1 Global Industrial Minerals Market Estimates and Forecasts, by Chemical, 2020-2030 (Thousand Tonnes)

5.3.3 Ceramic & Glass

5.3.3.1 Global Industrial Minerals Market Estimates and Forecasts, by Ceramic & Glass, 2020-2030 (Thousand Tonnes)

5.3.4 Others

5.3.4.1 Global Industrial Minerals Market Estimates and Forecasts, by Others, 2020-2030 (Thousand Tonnes)

Chapter 6 Industrial Minerals Regional Outlook

6.1 Industrial Minerals – Regional Deep Dive

6.2 North America

6.2.1 North America Industrial Minerals Market Estimates & Forecasts, 2020-2030 (Thousand Tonnes)

6.2.2 North America Industrial Minerals Market Estimates & Forecasts, by Commodity 2020-2030 (Thousand Tonnes)

6.2.3 North America Industrial Minerals Market Estimates & Forecasts, by End-Use 2020-2030 (Thousand Tonnes)

6.2.4 US

6.2.4.1 US Industrial Minerals Market Estimates & Forecasts, 2020-2030 (Thousand Tonnes)

6.2.4.2 US Industrial Minerals Market Estimates & Forecasts, by Commodity 2020-2030 (Thousand Tonnes)

6.2.4.3 US Industrial Minerals Market Estimates & Forecasts, by End-Use 2020-2030 (Thousand Tonnes)

6.2.5 Canada

6.2.5.1 Canada Industrial Minerals Market Estimates & Forecasts, 2020-2030 (Thousand Tonnes)

6.2.5.2 Canada Industrial Minerals Market Estimates & Forecasts, by Commodity 2020-2030 (Thousand Tonnes)

6.2.5.3 Canada Industrial Minerals Market Estimates & Forecasts, by End-Use 2020-2030 (Thousand Tonnes)

6.3 Europe

6.3.1 Europe Industrial Minerals Market Estimates & Forecasts, 2020-2030 (Thousand Tonnes)

6.3.2 Europe Industrial Minerals Market Estimates & Forecasts, by Commodity 2020-2030 (Thousand Tonnes)

6.3.3 Europe Industrial Minerals Market Estimates & Forecasts, by End-Use 2020-2030 (Thousand Tonnes)

6.3.4 Germany

6.3.4.1 Germany Industrial Minerals Market Estimates & Forecasts, 2020-2030 (Thousand Tonnes)

6.3.4.2 Germany Industrial Minerals Market Estimates & Forecasts, by Commodity 2020-2030 (Thousand Tonnes)

6.3.4.3 Germany Industrial Minerals Market Estimates & Forecasts, by End-Use 2020-2030 (Thousand Tonnes)

6.3.5 France

6.3.5.1 France Industrial Minerals Market Estimates & Forecasts, 2020-2030 (Thousand Tonnes)

6.3.5.2 France Industrial Minerals Market Estimates & Forecasts, by Commodity 2020-2030 (Thousand Tonnes)

6.3.5.3 France Industrial Minerals Market Estimates & Forecasts, by End-Use 2020-2030 (Thousand Tonnes)

6.3.6 UK

6.3.6.1 UK Industrial Minerals Market Estimates & Forecasts, 2020-2030 (Thousand Tonnes)

6.3.6.2 UK Industrial Minerals Market Estimates & Forecasts, by Commodity 2020-2030 (Thousand Tonnes)

6.3.6.3 UK Industrial Minerals Market Estimates & Forecasts, by End-Use 2020-2030 (Thousand Tonnes)

6.3.7 Russia

6.3.7.1 Russia Industrial Minerals Market Estimates & Forecasts, 2020-2030 (Thousand Tonnes)

6.3.7.2 Russia Industrial Minerals Market Estimates & Forecasts, by Commodity 2020-2030 (Thousand Tonnes)

6.3.7.3 Russia Industrial Minerals Market Estimates & Forecasts, by End-Use 2020-2030 (Thousand Tonnes)

6.3.8 Spain

6.3.8.1 Spain Industrial Minerals Market Estimates & Forecasts, 2020-2030 (Thousand Tonnes)

6.3.8.2 Spain Industrial Minerals Market Estimates & Forecasts, by Commodity 2020-2030 (Thousand Tonnes)

6.3.8.3 Spain Industrial Minerals Market Estimates & Forecasts, by End-Use 2020-2030 (Thousand Tonnes)

6.3.9 Rest of Europe

6.3.9.1 Rest of Europe Industrial Minerals Market Estimates & Forecasts, 2020-2030 (Thousand Tonnes)

6.3.9.2 Rest of Europe Industrial Minerals Market Estimates & Forecasts, by Commodity 2020-2030 (Thousand Tonnes)

6.3.9.3 Rest of Europe Industrial Minerals Market Estimates & Forecasts, by End-Use 2020-2030 (Thousand Tonnes)

6.4 Asia Pacific

6.4.1 Asia Pacific Industrial Minerals Market Estimates & Forecasts, 2020-2030 (Thousand Tonnes)

6.4.2 Asia Pacific Industrial Minerals Market Estimates & Forecasts, by Commodity 2020-2030 (Thousand Tonnes)

6.4.3 Asia Pacific Industrial Minerals Market Estimates & Forecasts, by End-Use 2020-2030 (Thousand Tonnes)

6.4.4 China

6.4.4.1 China Industrial Minerals Market Estimates & Forecasts, 2020-2030 (Thousand Tonnes)

6.4.4.2 China Industrial Minerals Market Estimates & Forecasts, by Commodity 2020-2030 (Thousand Tonnes)

6.4.4.3 China Industrial Minerals Market Estimates & Forecasts, by End-Use 2020-2030 (Thousand Tonnes)

6.4.5 India

6.4.5.1 India Industrial Minerals Market Estimates & Forecasts, 2020-2030 (Thousand Tonnes)

6.4.5.2 India Industrial Minerals Market Estimates & Forecasts, by Commodity 2020-2030 (Thousand Tonnes)

6.4.5.3 India Industrial Minerals Market Estimates & Forecasts, by End-Use 2020-2030 (Thousand Tonnes)

6.4.6 Australia

6.4.6.1 Australia Industrial Minerals Market Estimates & Forecasts, 2020-2030 (Thousand Tonnes)

6.4.6.2 Australia Industrial Minerals Market Estimates & Forecasts, by Commodity 2020-2030 (Thousand Tonnes)

6.4.6.3 Australia Industrial Minerals Market Estimates & Forecasts, by End-Use 2020-2030 (Thousand Tonnes)

6.4.7 South Korea

6.4.7.1 South Korea Industrial Minerals Market Estimates & Forecasts, 2020-2030 (Thousand Tonnes)

6.4.7.2 South Korea Industrial Minerals Market Estimates & Forecasts, by Commodity 2020-2030 (Thousand Tonnes)

6.4.7.3 South Korea Industrial Minerals Market Estimates & Forecasts, by End-Use 2020-2030 (Thousand Tonnes)

6.4.8 Rest of Asia Pacific

6.4.8.1 Rest of Asia Pacific Industrial Minerals Market Estimates & Forecasts, 2020-2030 (Thousand Tonnes)

6.4.8.2 Rest of Asia Pacific Industrial Minerals Market Estimates & Forecasts, by Commodity 2020-2030 (Thousand Tonnes)

6.4.8.3 Rest of Asia Pacific Industrial Minerals Market Estimates & Forecasts, by End-Use 2020-2030 (Thousand Tonnes)

6.5 Central & South America

6.5.1 Central & South America Industrial Minerals Market Estimates & Forecasts, 2020-2030 (Thousand Tonnes)

6.5.2 Central & South America Industrial Minerals Market Estimates & Forecasts, by Commodity 2020-2030 (Thousand Tonnes)

6.5.3 Central & South America Industrial Minerals Market Estimates & Forecasts, by End-Use 2020-2030 (Thousand Tonnes)

6.5.4 Brazil

6.5.4.1 Brazil Industrial Minerals Market Estimates & Forecasts, 2020-2030 (Thousand Tonnes)

6.5.4.2 Brazil Industrial Minerals Market Estimates & Forecasts, by Commodity 2020-2030 (Thousand Tonnes)

6.5.4.3 Brazil Industrial Minerals Market Estimates & Forecasts, by End-Use 2020-2030 (Thousand Tonnes)

6.5.5 Rest of Central & South America

6.5.5.1 Rest of Central & South America Industrial Minerals Market Estimates & Forecasts, 2020-2030 (Thousand Tonnes)

6.5.5.2 Rest of Central & South America Industrial Minerals Market Estimates & Forecasts, by Commodity 2020-2030 (Thousand Tonnes)

6.5.5.3 Rest of Central & South America Industrial Minerals Market Estimates & Forecasts, by End-Use 2020-2030 (Thousand Tonnes)

6.6 Middle East & Africa

6.6.1 Middle East & Africa Industrial Minerals Market Estimates & Forecasts, 2020-2030 (Thousand Tonnes)

6.6.2 Middle East & Africa Industrial Minerals Market Estimates & Forecasts, by Commodity 2020-2030 (Thousand Tonnes)

6.6.3 Middle East & Africa Industrial Minerals Market Estimates & Forecasts, by End-Use 2020-2030 (Thousand Tonnes)

6.6.4 Saudi Arabia

6.6.4.1 Saudi Arabia Industrial Minerals Market Estimates & Forecasts, 2020-2030 (Thousand Tonnes)

6.6.4.2 Saudi Arabia Industrial Minerals Market Estimates & Forecasts, by Commodity 2020-2030 (Thousand Tonnes)

6.6.4.3 Saudi Arabia Industrial Minerals Market Estimates & Forecasts, by End-Use 2020-2030 (Thousand Tonnes)

6.6.5 South Africa

6.6.5.1 South Africa Industrial Minerals Market Estimates & Forecasts, 2020-2030 (Thousand Tonnes)

6.6.5.2 South Africa Industrial Minerals Market Estimates & Forecasts, by Commodity 2020-2030 (Thousand Tonnes)

6.6.5.3 South Africa Industrial Minerals Market Estimates & Forecasts, by End-Use 2020-2030 (Thousand Tonnes)

6.6.6 Rest of Middle East & Africa

6.6.6.1 Rest of Middle East & Africa Industrial Minerals Market Estimates & Forecasts, 2020-2030 (Thousand Tonnes)

6.6.6.2 Rest of Middle East & Africa Industrial Minerals Market Estimates & Forecasts, by Commodity 2020-2030 (Thousand Tonnes)

6.6.6.3 Rest of Middle East & Africa Industrial Minerals Market Estimates & Forecasts, by End-Use 2020-2030 (Thousand Tonnes)

Chapter 7 Competitive Landscape

7.1 Key Players & Recent Developments & Their Impact on the Industry

7.2 List of Key Emerging Companies/Technology Disruptors/Innovators

7.3 List of Equipment Suppliers

Chapter 8 Company Profiles

8.1 The Mosaic Co

8.2 Yara International ASA

8.3 Israel Corporation Ltd

8.4 Saudi Arabian Mining Co

8.5 Nutrien Ltd

8.6 Holcim Ltd

8.7 CRH Plc

8.8 Vulcan Materials Co

8.9 UltraTech Cement Ltd

8.10 CEMEX SAB de CV

8.11 Imerys SA

8.12 K+S AG

8.13 SCR-Sibelco NV

8.14 Compagnie de Saint-Gobain

8.15 Syrah Resources Ltd

Figures

Fig 1: Industrial Minerals CAGR by Commodity, 2023 -2030

Fig 2: Industrial Minerals CAGR by End-Use, 2023 -2030

Fig 3: Industrial Minerals Market – Segmentation

Fig 4: Industrial Minerals Market – Process Flow

Fig 5: Industrial Minerals Market – Commodity Overview

Fig 6: Global Industrial Minerals Market – Volume Opportunity Forecast, 2020-2030 (Thousand Tonnes)

Fig 7: Global Industrial Minerals Market Estimates & Forecasts, by Commodity, 2020-2030 (%)

Fig 8: Global Industrial Minerals Market Share Estimates & Forecasts, by Commodity, 2020-2030 (Thousand Tonnes)

Fig 9: Global Industrial Minerals Market Estimates & Forecasts, by End-Use, 2020-2030 (%)

Fig 10: Global Industrial Minerals Market Share Estimates & Forecasts, by End-Use, 2020-2030 (Thousand Tonnes)

Fig 11: North America Industrial Minerals Market Estimates & Forecasts, 2020-2030 (Thousand Tonnes)

Fig 12: North America Industrial Minerals Market Estimates & Forecasts, by Country, 2020-2030 (Thousand Tonnes)

Fig 14: North America Industrial Minerals Market Estimates & Forecasts, by Commodity, 2020-2030 (Thousand Tonnes)

Fig 15: North America Industrial Minerals Market Estimates & Forecasts, by End-Use, 2020-2030 (Thousand Tonnes)

Fig 16: U.S. Industrial Minerals Market Estimates & Forecasts, 2020-2030 (Thousand Tonnes)

Fig 17: U.S. Industrial Minerals Market Estimates & Forecasts, by Commodity, 2020-2030 (Thousand Tonnes)

Fig 18: U.S. Industrial Minerals Market Estimates & Forecasts, by End-Use, 2020-2030 (Thousand Tonnes)

Fig 19: Canada Industrial Minerals Market Estimates & Forecasts, 2020-2030 (Thousand Tonnes)

Fig 20: Canada Industrial Minerals Market Estimates & Forecasts, by Commodity, 2020-2030 (Thousand Tonnes)

Fig 21: Canada Industrial Minerals Market Estimates & Forecasts, by End-Use, 2020-2030 (Thousand Tonnes)

Fig 22: Europe Industrial Minerals Market Estimates & Forecasts, 2020-2030 (Thousand Tonnes)

Fig 23: Europe Industrial Minerals Market Estimates & Forecasts, by Country, 2020-2030 (Thousand Tonnes)

Fig 24: Europe Industrial Minerals Market Estimates & Forecasts, by Commodity, 2020-2030 (Thousand Tonnes)

Fig 25: Europe Industrial Minerals Market Estimates & Forecasts, by End-Use, 2020-2030 (Thousand Tonnes)

Fig 26: Germany Industrial Minerals Market Estimates & Forecasts, 2020-2030 (Thousand Tonnes)

Fig 27: Germany Industrial Minerals Market Estimates & Forecasts, by Commodity, 2020-2030 (Thousand Tonnes)

Fig 28: Germany. Industrial Minerals Market Estimates & Forecasts, by End-Use, 2020-2030 (Thousand Tonnes)

Fig 29: France Industrial Minerals Market Estimates & Forecasts, 2020-2030 (Thousand Tonnes)

Fig 30: France Industrial Minerals Market Estimates & Forecasts, by Commodity, 2020-2030 (Thousand Tonnes)

Fig 31: France Industrial Minerals Market Estimates & Forecasts, by End-Use, 2020-2030 (Thousand Tonnes)

Fig 32: UK Industrial Minerals Market Estimates & Forecasts, 2020-2030 (Thousand Tonnes)

Fig 33: UK Industrial Minerals Market Estimates & Forecasts, by Commodity, 2020-2030 (Thousand Tonnes)

Fig 34: UK Industrial Minerals Market Estimates & Forecasts, by End-Use, 2020-2030 (Thousand Tonnes)

Fig 35: Russia Industrial Minerals Market Estimates & Forecasts, 2020-2030 (Thousand Tonnes)

Fig 36: Russia Industrial Minerals Market Estimates & Forecasts, by Commodity, 2020-2030 (Thousand Tonnes)

Fig 37: Russia Industrial Minerals Market Estimates & Forecasts, by End-Use, 2020-2030 (Thousand Tonnes)

Fig 38: Spain Industrial Minerals Market Estimates & Forecasts, 2020-2030 (Thousand Tonnes)

Fig 39: Spain Industrial Minerals Market Estimates & Forecasts, by Commodity, 2020-2030 (Thousand Tonnes)

Fig 40: Spain Industrial Minerals Market Estimates & Forecasts, by End-Use, 2020-2030 (Thousand Tonnes)

Fig 41: Rest of Europe Industrial Minerals Market Estimates & Forecasts, 2020-2030 (Thousand Tonnes)

Fig 42: Rest of Europe Industrial Minerals Market Estimates & Forecasts, by Commodity, 2020-2030 (Thousand Tonnes)

Fig 43: Rest of Europe Industrial Minerals Market Estimates & Forecasts, by End-Use, 2020-2030 (Thousand Tonnes)

Fig 44: Asia Pacific Industrial Minerals Market Estimates & Forecasts, 2020-2030 (Thousand Tonnes)

Fig 45: Asia Pacific Industrial Minerals Market Estimates & Forecasts, by Country, 2020-2030 (Thousand Tonnes)

Fig 46: Asia Pacific Industrial Minerals Market Estimates & Forecasts, by Commodity, 2020-2030 (Thousand Tonnes)

Fig 47: Asia Pacific Industrial Minerals Market Estimates & Forecasts, by End-Use, 2020-2030 (Thousand Tonnes)

Fig 48: China Industrial Minerals Market Estimates & Forecasts, 2020-2030 (Thousand Tonnes)

Fig 49: China Industrial Minerals Market Estimates & Forecasts, by Commodity, 2020-2030 (Thousand Tonnes)

Fig 50: China. Industrial Minerals Market Estimates & Forecasts, by End-Use, 2020-2030 (Thousand Tonnes)

Fig 51: India Industrial Minerals Market Estimates & Forecasts, 2020-2030 (Thousand Tonnes)

Fig 52: India Industrial Minerals Market Estimates & Forecasts, by Commodity, 2020-2030 (Thousand Tonnes)

Fig 53: India Industrial Minerals Market Estimates & Forecasts, by End-Use, 2020-2030 (Thousand Tonnes)

Fig 54: Australia Industrial Minerals Market Estimates & Forecasts, 2020-2030 (Thousand Tonnes)

Fig 55: Australia Industrial Minerals Market Estimates & Forecasts, by Commodity, 2020-2030 (Thousand Tonnes)

Fig 56: Australia Industrial Minerals Market Estimates & Forecasts, by End-Use, 2020-2030 (Thousand Tonnes)

Fig 57: South Korea Industrial Minerals Market Estimates & Forecasts, 2020-2030 (Thousand Tonnes)

Fig 58: South Korea Industrial Minerals Market Estimates & Forecasts, by Commodity, 2020-2030 (Thousand Tonnes)

Fig 59: South Korea Industrial Minerals Market Estimates & Forecasts, by End-Use, 2020-2030 (Thousand Tonnes)

Fig 60: Rest of Asia Pacific Industrial Minerals Market Estimates & Forecasts, 2020-2030 (Thousand Tonnes)

Fig 61: Rest of Asia Pacific Industrial Minerals Market Estimates & Forecasts, by Commodity, 2020-2030 (Thousand Tonnes)

Fig 62: Rest of Asia Pacific Industrial Minerals Market Estimates & Forecasts, by End-Use, 2020-2030 (Thousand Tonnes)

Fig 63: Central & South America Industrial Minerals Market Estimates & Forecasts, 2020-2030 (Thousand Tonnes)

Fig 64: Central & South America Industrial Minerals Market Estimates & Forecasts, by Country, 2020-2030 (Thousand Tonnes)

Fig 65: Central & South America Industrial Minerals Market Estimates & Forecasts, by Commodity, 2020-2030 (Thousand Tonnes)

Fig 66: Central & South America Industrial Minerals Market Estimates & Forecasts, by End-Use, 2020-2030 (Thousand Tonnes)

Fig 67: Brazil Industrial Minerals Market Estimates & Forecasts, 2020-2030 (Thousand Tonnes)

Fig 68: Brazil Industrial Minerals Market Estimates & Forecasts, by Commodity, 2020-2030 (Thousand Tonnes)

Fig 69: Brazil. Industrial Minerals Market Estimates & Forecasts, by End-Use, 2020-2030 (Thousand Tonnes)

Fig 70: Rest of Central & South America Industrial Minerals Market Estimates & Forecasts, 2020-2030 (Thousand Tonnes)

Fig 71: Rest of Central & South America Industrial Minerals Market Estimates & Forecasts, by Commodity, 2020-2030 (Thousand Tonnes)

Fig 72: Rest of Central & South America Industrial Minerals Market Estimates & Forecasts, by End-Use, 2020-2030 (Thousand Tonnes)

Fig 73: Middle East & Africa Industrial Minerals Market Estimates & Forecasts, 2020-2030 (Thousand Tonnes)

Fig 74: Middle East & Africa Industrial Minerals Market Estimates & Forecasts, by Country, 2020-2030 (Thousand Tonnes)

Fig 75: Middle East & Africa Industrial Minerals Market Estimates & Forecasts, by Commodity, 2020-2030 (Thousand Tonnes)

Fig 76: Middle East & Africa Industrial Minerals Market Estimates & Forecasts, by End-Use, 2020-2030 (Thousand Tonnes)

Fig 77: Saudi Arabia Industrial Minerals Market Estimates & Forecasts, 2020-2030 (Thousand Tonnes)

Fig 78: Saudi Arabia Industrial Minerals Market Estimates & Forecasts, by Commodity, 2020-2030 (Thousand Tonnes)

Fig 79: Saudi Arabia. Industrial Minerals Market Estimates & Forecasts, by End-Use, 2020-2030 (Thousand Tonnes)

Fig 80: South Africa Industrial Minerals Market Estimates & Forecasts, 2020-2030 (Thousand Tonnes)

Fig 81: South Africa Industrial Minerals Market Estimates & Forecasts, by Commodity, 2020-2030 (Thousand Tonnes)

Fig 82: South Africa Industrial Minerals Market Estimates & Forecasts, by End-Use, 2020-2030 (Thousand Tonnes)

Fig 83: Rest of Middle East & Africa Industrial Minerals Market Estimates & Forecasts, 2020-2030 (Thousand Tonnes)

Fig 84: Rest of Middle East & Africa Industrial Minerals Market Estimates & Forecasts, by Commodity, 2020-2030 (Thousand Tonnes)

Fig 85: Rest of Middle East & Africa Industrial Minerals Market Estimates & Forecasts, by End-Use, 2020-2030 (Thousand Tonnes)

Frequently asked questions

  • What will be the industrial minerals market size in 2023?

    The industrial minerals market size globally will reach 2,377.7 Million Tonnes in 2023.

  • What is the industrial minerals market growth rate?

    The industrial minerals market is expected to grow at a CAGR of 2.8% over the forecast period (2023-2030).

  • What are the key industrial minerals market drivers?

    The expansion of the construction sector with a focus on infrastructural development and the growing chemical manufacturing vertical are anticipated to remain key drivers for industrial minerals market growth over the forecast period.

  • What are the key industrial minerals market segments?

    Commodity Segments: Barite, Bentonite, Boron, Diatomite, Dolomite, Feldspar, Fluorspar, Graphite, Gypsum and Anhydrite, Kaolin, Limestone, Phosphate Rock, Potash, and Salt

    End-Use Segments: Construction & Material, Chemical, Ceramic & Glass, and Others

  • Which are the leading industrial minerals companies?

    The leading industrial minerals companies are The Mosaic Co, KaMin LLC, Imerys, Sibelco, Quarzwerke GmbH, Thiele Kaolin Company, I-Minerals Inc., Gypsum Resources Materials, Ashapura Group, Clariant, Ma’aden, Omya AG, Minerals Technologies Inc., Vulcan Materials Company, and CRH Americas Materials, Inc.

  • Is there a third level of segmentation in the report?

    GlobalData’s focus is on providing reliable and accurate data that is supported by robust research methodology. Our reports undergo rigorous quality checks and are based on primary and secondary research sources, ensuring that the numbers and insights provided are trustworthy. However, despite the best efforts to gather comprehensive data, there could be instances where the available data is limited, making it challenging to provide third-level segmentation. In such cases, GlobalData may choose to provide high-level insights and general trends rather than forcing segmentation that may not be backed by sufficient data. This approach ensures that the report’s overall quality and credibility are maintained.

Currency USD
$3,950

Can be used by individual purchaser only

$7,950

Can be shared globally by unlimited users within the purchasing corporation e.g. all employees of a single company


Undecided about purchasing this report?

Enquire Before Buying Request a Free Sample

Get in touch to find out about multi-purchase discounts

reportstore@globaldata.com
Tel +44 20 7947 2745

Every customer’s requirement is unique. With over 220,000 construction projects tracked, we can create a tailored dataset for you based on the types of projects you are looking for. Please get in touch with your specific requirements and we can send you a quote.

Sample Report

We are confident about Industrial Minerals Market Size, Share, Trends and Analysis by Region, Commodity, End-Use and Segment Forecast to 2030 report's unique quality. However, we want you to make the most beneficial decision for your business, so we offer free sample pages to help you:

  • Assess the relevance of the report
  • Evaluate the quality of the report
  • Justify the cost

Download your copy of the sample report and make an informed decision about whether the full report will provide you with the insights and information you need.

Below is a sample report to understand what you are buying

See what our customers are saying

“The GlobalData platform is our go-to tool for intelligence services. GlobalData provides an easy way to access comprehensive intelligence data around multiple sectors, which essentially makes it a one-for-all intelligence platform, for tendering and approaching customers.

GlobalData is very customer orientated, with a high degree of personalised services, which benefits everyday use. The highly detailed project intelligence and forecast reports can be utilised across multiple departments and workflow scopes, from operational to strategic level, and often support strategic decisions. GlobalData Analytics and visualisation solutions has contributed positively when preparing management presentations and strategic papers.”

Business Intelligence & Marketing Manager, SAL Heavy Lift

“COVID-19 has caused significant interference to our business and the COVID-19 intelligence from GlobalData has helped us reach better decisions around strategy. These two highlights have helped enormously to understand the projections into the future concerning our business units, we also utilise the project database to source new projects for Liebherr-Werk to use as an additional source to pitch for new business.”

Market Analyst & Management, Liebherr-Werk

Your daily news has saved me a lot of time and keeps me up-to-date with what is happening in the market, I like that you almost always have a link to the source origin. We also use your market data in our Strategic Business Process to support our business decisions. By having everything in one place on the Intelligence Center it has saved me a lot of time versus looking on different sources, the alert function also helps with this.

Head of Key Accounts, Saab AB

Having used several other market research companies, I find that GlobalData manages to provide that ‘difficult-to-get’ market data that others can’t, as well as very diverse and complete consumer surveys.

Marketing Intelligence Manager, Portugal Foods

Our experience with GlobalData has been very good, from the platform itself to the people. I find that the analysts and the account team have a high level of customer focus and responsiveness and therefore I can always rely on. The platform is more holistic than other providers. It is convenient and almost like a one stop shop. The pricing suite is highly competitive and value for our organisation.

I like reports that inform new segments such as the analysis on generation Z, millennials, the impact of COVID 19 to our banking customers and their new channel habits. Secondly the specialist insight on affluent sector significantly increases our understanding about this group of customers. The combination of those give us depth and breadth of the evolving market.

I’m in the business of answering and helping people make decisions so with the intelligence center I can do that, effectively and efficiently. I can share quickly key insights that answer and satisfy our country stakeholders by giving them many quality studies and primary research about competitive landscape beyond the outlook of our bank. It helps me be seen as an advisory partner and that makes a big difference. A big benefit of our subscription is that no one holds the whole data and because it allows so many people, so many different parts of our organisation have access, it enables all teams to have the same level of knowledge and decision support.

Head of Customer Insight and Research, Standard Chartered

“I know that I can always rely on Globaldata’s work when I’m searching for the right consumer and market insights. I use Globaldata insights to understand the changing market & consumer landscape and help create better taste & wellbeing solutions for our customers in food, beverage and healthcare industries.

Globaldata has the right data and the reports are of very high quality compared to your competitors. Globaldata not only has overall market sizes & consumer insights on food & beverages but also provides insights at the ingredient & flavour level. That is key for B2B companies like Givaudan. This way we understand our customers’ business and also gain insight to our unique industry”

Head of Consumer Sensory Insights, Givaudan

GlobalData provides a great range of information and reports on various sectors that is highly relevant, timely, easy to access and utilise.  The reports and data dashboards help engagement with clients; they provide valuable industry and market insights that can enrich client conversations and can help in the shaping of value propositions. Moreover, using GlobalData products has helped increase my knowledge of the finance sector, the players within it, and the general threats and opportunities.

I find the consumer surveys that are carried out to be extremely beneficial and not something I have seen anywhere else. They provided an insightful view of why and which consumers take (or don’t) particular financial products. This can help shape conversations with clients to ensure they make the right strategic decisions for their business.

One of the challenges I have found is that data in the payments space is often piecemeal. With GD all of the data I need is in one place, but it also comes with additional market reports that provide useful extra context and information. Having the ability to set-up alerts on relevant movements in the industry, be it competitors or customers, and have them emailed directly to me, ensures I get early sight of industry activity and don’t have to search for news.

Senior Account Manager, TSYS
Go even deeper with GlobalData Intelligence Center

Every Company Report we produce is powered by the GlobalData Intelligence Center.

Subscribing to our intelligence platform means you can monitor developments at Industrial Minerals Market Size, Share, Trends and Analysis by Region, Commodity, End-Use and Segment Forecast to 2030 in real time.

  • Access a live Industrial Minerals Market Size, Share, Trends and Analysis by Region, Commodity, End-Use and Segment Forecast to 2030 dashboard for 12 months, with up-to-the-minute insights.
  • Fuel your decision making with real-time deal coverage and media activity.
  • Turn insights on financials, deals, products and pipelines into powerful agents of commercial advantage.