Oil and Gas Pipelines Length and Capital Expenditure Outlook by Region, Countries, Companies, Projects and Forecast to 2027
Powered by ![]()
All the vital news, analysis, and commentary curated by our industry experts.

Oil and Gas Pipelines Length and CapEx Forecast Report Overview
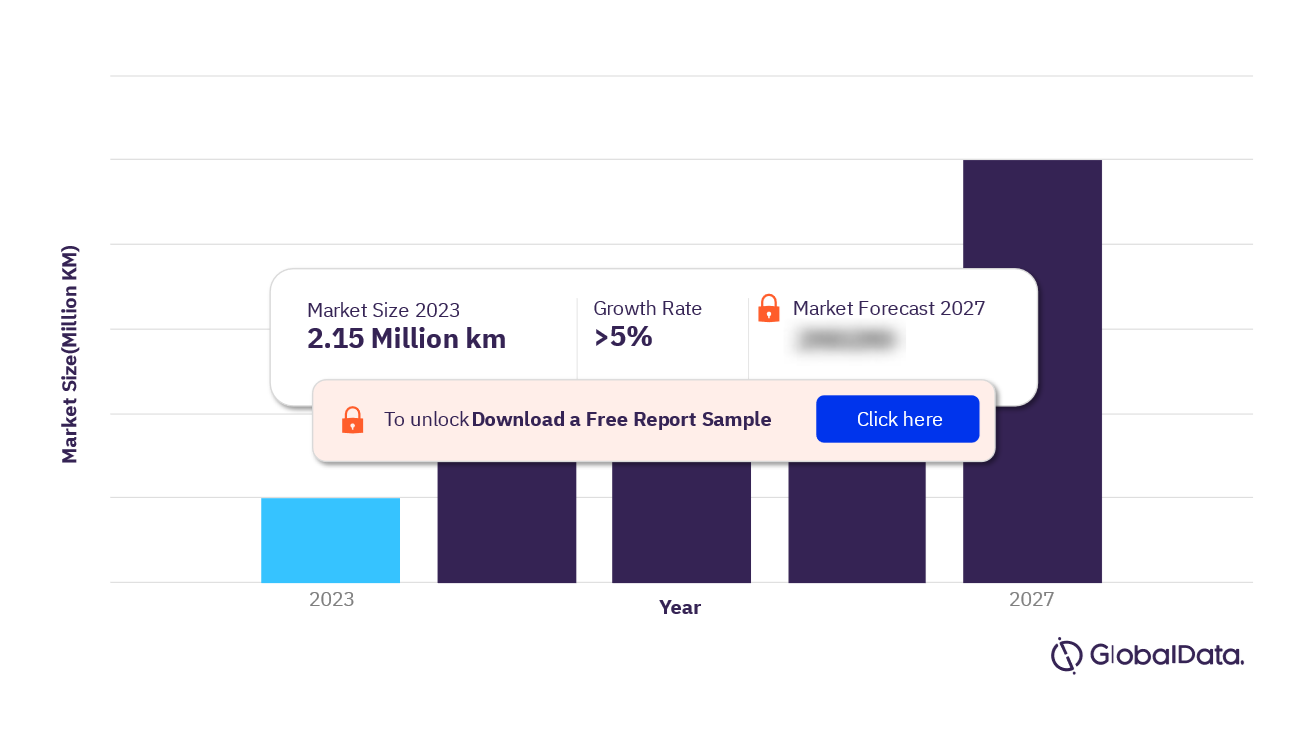
The total length of global oil and gas trunk pipelines is 2.15 million km in 2023 and is expected to grow by more than 5% by 2027.
The oil and gas pipelines market research report provide up-to-date major trunk or transmission oil and gas pipeline length data by major regions globally, and an outlook of the planned and announced pipeline length up to 2027. The report also provides an annual breakdown of new build capex on planned and announced pipelines by major regions globally for the period 2023 to 2027.
Oil and Gas Pipelines Market Outlook, 2023-2027
For more insights into the oil and gas pipelines market forecast, download a free report sample
Oil and Gas Pipelines Plants – Major Announced Projects
Some of the major oil and gas pipelines plants that have been announced are as follows:
Southeast Gateway: Southeast Gateway is an announced onshore, shallow-water gas pipeline in Mexico with a length of 715 km. It is expected to start in Veracruz and end in Tabasco. TC Energy Corporation is the operator as well as a 100% equity stake in the pipeline.
Vaca Muerta: Vaca Muerta is an announced onshore gas pipeline in Argentina with a length of 600 km. YPF SA is the operator as well as a 50% equity holder in the pipeline. Petroliam Nasional Bhd holds the remaining 50% stake in the project.
Tioga–Emerson Project: Tioga–Emerson Project is an announced onshore gas pipeline with a pipeline length of 531 km and is expected to start operations in 2023. It is anticipated to start in North Dakota and end in Minnesota, both in the US.
San Jeronimo-Uruguayana: San Jeronimo-Uruguayana is an announced onshore gas pipeline with a length of 450 km. It is anticipated to start in San Jeronimo, Argentina, and end in Uruguayana, Brazil.
Oil and Gas Pipelines Length and CapEx by Regions
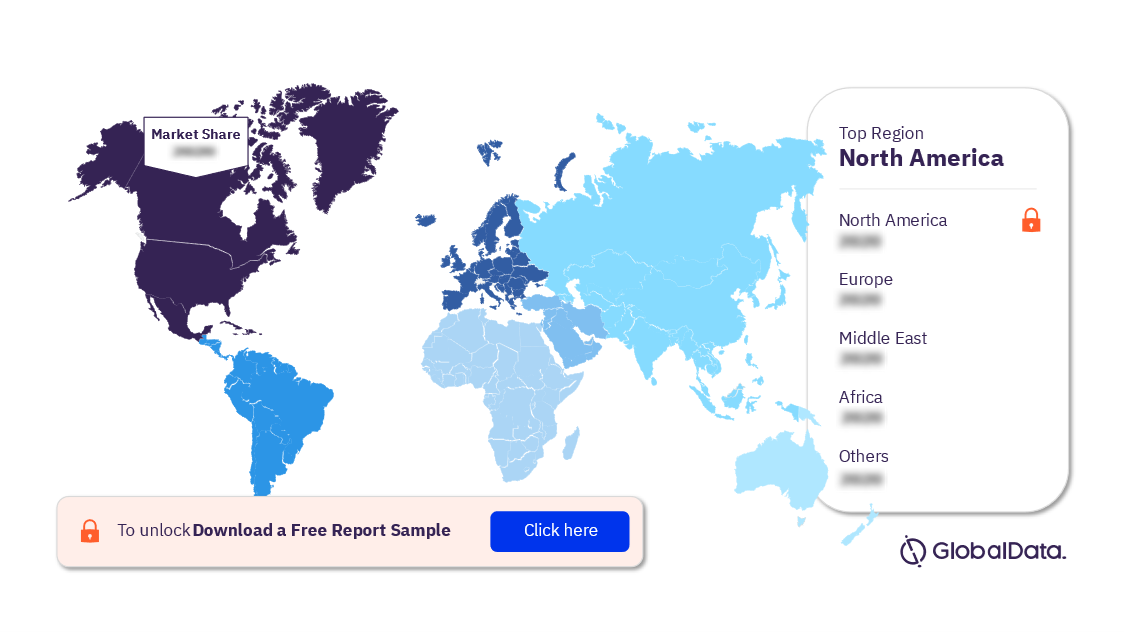
The key regions analyzed in the oil and gas pipeline industry are North America, the Middle East, the Former Soviet Union, Europe, Central America, Africa, Asia, South America, Oceania, and the Caribbean. North America leads the total pipeline length, followed by the Former Soviet Union (FSU) by 2027.
Among countries, India leads with the highest planned and announced pipeline length from 2023 to 2027. China stands second, followed by the US, Russia, and Iran.
Oil and Gas Pipelines Length Analysis by Regions, 2023-2027 (%)
For more regional insights into the oil and gas pipelines market, download a free report sample
Oil and Gas Pipelines Length and CapEx - Competitive Landscape
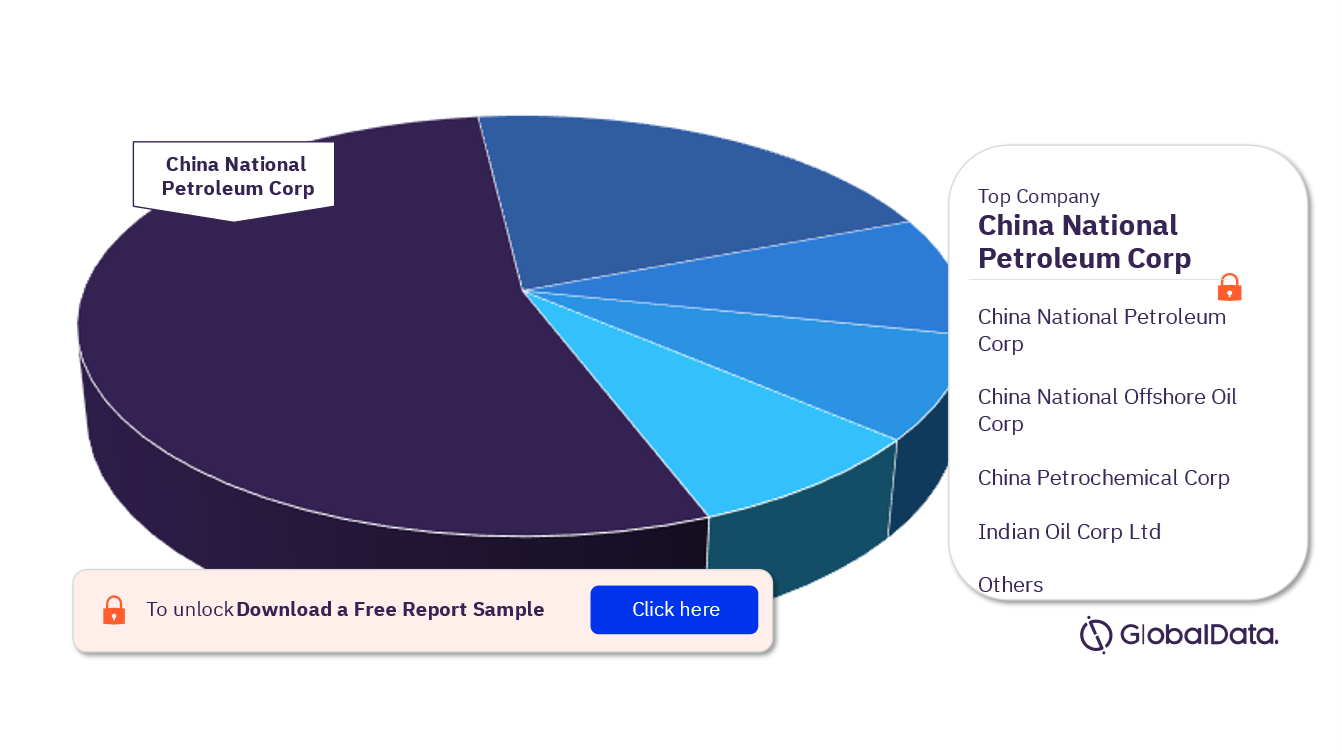
Some of the leading companies in the oil and gas pipelines industry are China National Petroleum Corp (CNPC), China National Offshore Oil Corp (CNOOC), China Petrochemical Corp (CPC), Indian Oil Corp Ltd, China Oil & Gas Piping Network Corp, Bharat Petroleum Corp Ltd, and Oil and Natural Gas Corp Ltd among others. China National Petroleum Corp leads globally with the highest planned and announced pipeline length during the outlook period 2023–2027, followed by CNOOC and CPC.
Oil and Gas Pipelines Length Analysis by Companies, 2023-2027 (%)
To know more about the leading companies in the oil and gas pipelines market, download a free report sample
Oil and Gas Pipelines Market Report Overview
| Market Size (2023) | 2.15 million km |
| Growth Rate (by 2027) | >5% |
| Key Regions | North America, the Middle East, the Former Soviet Union, Europe, Central America, Africa, Asia, South America, Oceania, and The Caribbean |
| Leading Companies | China National Petroleum Corp, China National Offshore Oil Corp, China Petrochemical Corp, Indian Oil Corp Ltd, China Oil & Gas Piping Network Corp, Bharat Petroleum Corp Ltd, and Oil and Natural Gas Corp Ltd |
Segments Covered in the Report
Oil and gas pipelines Regional Outlook (2023-2027)
- North America
- Middle East
- Former Soviet Union
- Europe
- Central America
- Africa
- Asia
- South America
- Oceania
- Caribbean
Scope
- Up to date major trunk or transmission oil and gas pipelines length data by major regions globally, outlook of the planned and announced pipeline length up to 2027
- Annual breakdown of new build capex on planned and announced pipelines by major regions globally for the period 2023 to 2027
- New build pipeline length and capital expenditure by key countries and companies globally
- Regional new build capex outlook for planned and announced pipelines by key countries and companies
- Details of major new build pipelines expected to start operations over the next four years by commodity (crude oil, natural gas, NGL and petroleum product pipelines)
Reasons to Buy
- Obtain the most up to date information available on planned and announced major, trunk oil and gas pipelines globally
- Assess your competitor’s planned and announced pipelines, proposed lengths and capital expenditure
- Identify growth segments and opportunities in the global pipeline industry
- Keep abreast of key global planned and announced pipelines
- Facilitate decision-making based on strong planned and announced pipeline data
- Develop business strategies with the help of specific insights about planned and announced pipelines in the world
China National Offshore Oil Corp
China Petrochemical Corp
Indian Oil Corp Ltd
China Oil & Gas Piping Network Corp
Bharat Petroleum Corp Ltd
Oil and Natural Gas Corp Ltd
Table of Contents
Table
Figures
Frequently asked questions
-
What is the oil and gas pipelines length in 2023?
The total length of global oil and gas trunk pipelines is 2.15 million km in 2023.
-
What is the oil and gas pipeline length growth rate?
The total length of global oil and gas trunk pipelines is expected to grow by more than 5% by 2027.
-
Which key regions have been analyzed in the oil and gas pipeline industry?
The key regions analyzed in the oil and gas pipeline industry are North America, the Middle East, the Former Soviet Union, Europe, Central America, Africa, Asia, South America, Oceania, and the Caribbean.
-
Which are the leading companies in the oil and gas pipeline industry?
Some of the leading companies in the oil and gas pipelines industry are China National Petroleum Corp, China National Offshore Oil Corp, China Petrochemical Corp, Indian Oil Corp Ltd, China Oil & Gas Piping Network Corp, Bharat Petroleum Corp Ltd, and Oil and Natural Gas Corp Ltd.
Get in touch to find out about multi-purchase discounts
reportstore@globaldata.com
Tel +44 20 7947 2745
Every customer’s requirement is unique. With over 220,000 construction projects tracked, we can create a tailored dataset for you based on the types of projects you are looking for. Please get in touch with your specific requirements and we can send you a quote.
Sample Report
Oil and Gas Pipelines Length and Capital Expenditure Outlook by Region, Countries, Companies, Projects and Forecast to 2027 was curated by the best experts in the industry and we are confident about its unique quality. However, we want you to make the most beneficial decision for your business, so we offer free sample pages to help you:
- Assess the relevance of the report
- Evaluate the quality of the report
- Justify the cost
Download your copy of the sample report and make an informed decision about whether the full report will provide you with the insights and information you need.


