Refining Industry Capacity and Capital Expenditure Forecast by Region, Countries and All Operating and Planned Refineries to 2027

Powered by

All the vital news, analysis, and commentary curated by our industry experts.

Refining Industry Capacity and Capital Expenditure Market Report Overview

The total active refining capacity was 108,213 mbd in 2022. It is expected to increase at an AAGR of more than 3% during 2022-2027. The report offers the most up-to-date information available on all active, suspended, planned, and announced refineries globally. It also covers the growth segments and opportunities in the refining industry.

Refining Industry Capacity and Capital Expenditure Outlook, 2022-2027 (mbd)

Refining Industry Capacity and Capital Expenditure Outlook, 2022-2027 (mbd)

Buy the Full Report for More Insights into the Refining Capacity And Capex Market Forecast, Download A Free Report Sample

The Refining Industry Capacity and Capital Expenditure market research report provides information on all active and upcoming (planned and announced) refineries globally. The report facilitates decision making on the basis of  strong refinery capacity data. It also assess the competitor’s refinery portfolio.

Market Size (2022) 108,213 mbd
AAGR (2022-2027) >3%
Forecast Period 2023-2027
Historical Period 2017-2022
Major Planned and Announced Refineries ·       Dangote Oil Refinery Ltd

·       Siraf Refineries Infrastructure Co

·       Hambantota Oil Refinery Pvt Ltd

·       Pakistan State Oil Co Ltd

·       Saudi Basic Industries Corp

Key Regions ·       Africa

·       Asia

·       Caribbean

·       Central America

·       Europe

·       Former Soviet Union

·       Middle East

·       North America

·       Oceania

·       South America

Key Countries ·       The US

·       China

·       Russia

·       India

·       South Korea

Enquire & Decide Discover the perfect solution for your business needs. Enquire now and let us help you make an informed decision before making a purchase.

Refining Industry Planned and Announced Refineries

The major operators among the new planned and announced refineries are Dangote Oil Refinery Ltd, Siraf Refineries Infrastructure Co, Hambantota Oil Refinery Pvt Ltd, Pakistan State Oil Co Ltd, and Saudi Basic Industries Corp among others.

Refining Industry Capacity and Capital Expenditure Segmentation by Regions

The key regions in the refining industry are Africa, Asia, the Caribbean, Central America, Europe, the Former Soviet Union, the Middle East, North America, Oceania, and South America. Among the regions, Asia leads with the largest capacity contribution, followed by North America.

Refining Industry Capacity and Capital Expenditure Analysis by Regions, 2022 (%)

Refining Industry Capacity and Capital Expenditure Analysis by Regions, 2022 (%)

Buy the Full Report for More Regional Insights into the Refining Industry Capacity and Capital Expenditure, Download A Free Report Sample

Refining Market Segmentation by Countries

The key countries in the refining industry are the US, China, Russia, India, and South Korea, among others. The US led among all the other countries. Paraguana (Venezuela), Ulsan (South Korea), and Ruwais (United Arab Emirates), were a few of the largest refineries in the world in terms of refining capacity in 2022.

Refining Industry Capacity and Capital Expenditure Analysis by Countries, 2022 (%)

Refining Industry Capacity and Capital Expenditure Analysis by Countries, 2022 (%)

Buy the Full Report for More Regional Insights into the Refining Industry Capacity and Capital Expenditure Analysis, Download a Free Report Sample

Segments Covered in the Report

Refining Market Regional Outlook (Capacity, mbd, 2017-2027)

  • Africa
  • Asia
  • Caribbean
  • Central America
  • Europe
  • Former Soviet Union
  • Middle East
  • North America
  • Oceania
  • South America

Refining Market Country Outlook (Capacity, mbd, 2017-2027)

  • The US
  • China
  • Russia
  • India
  • South Korea

Scope

The report:

  • Provides key details such as refinery name, operator name, refinery type, and status for all active, suspended, planned, and announced refineries in a country.
  • Provides an annual breakdown of new-build and expansion capital expenditure outlook by region and by key countries for the period 2023–2027.
  • Provides the latest developments and contracts related to a refinery, at the regional level, wherever available.

Reasons to Buy

  • Obtain the most up-to-date information available on all active, suspended, planned, and announced refineries globally.
  • Identify growth segments and opportunities in the refining industry.
  • Facilitate decision-making on the basis of strong refinery capacity data.
  • Assess your competitor’s refinery portfolio.

Table of Contents

1. Introduction 2

1.1 What is this Report About? 2

1.2 Market Definition 2

List of Figures 9

List of Tables 12

2. Global Refining Industry 25

2.1 Global Refining Industry, Snapshot 25

2.2 Global Refining Industry, Planned and Announced Refineries 32

2.3 Global Refining Industry, New Units and Capacity Expansions by Key Countries 35

2.4 Global Refining Industry, Regional Comparisons 45

3. Africa Refining Industry 48

3.1 Africa Refining Industry, Snapshot 48

3.2 Africa Refining Industry, Planned and Announced Refineries, Capacity Expansions and Capex by Country 55

3.3 Africa Refining Industry, New Units and Capacity Expansions by Key Countries 60

3.4 Africa Refining Industry, Egypt 66

3.5 Africa Refining Industry, Algeria 70

3.6 Africa Refining Industry, South Africa 72

3.7 Africa Refining Industry, Nigeria 74

3.8 Africa Refining Industry, Libya 78

3.9 Africa Refining Industry, Morocco 79

3.10 Africa Refining Industry, Sudan 80

3.11 Africa Refining Industry, Angola 83

3.12 Africa Refining Industry, Cote d’Ivoire 85

3.13 Africa Refining Industry, Cameroon 86

3.14 Africa Refining Industry, Ghana 87

3.15 Africa Refining Industry, Djibouti 88

3.16 Africa Refining Industry, Tunisia 90

3.17 Africa Refining Industry, Gabon 91

3.18 Africa Refining Industry, Zambia 92

3.19 Africa Refining Industry, Senegal 93

3.20 Africa Refining Industry, Niger 94

3.21 Africa Refining Industry, Chad 95

3.22 Africa Refining Industry, Congo Republic 96

3.23 Africa Refining Industry, South Sudan 98

3.24 Africa Refining Industry, Liberia 99

3.25 Africa Refining Industry, Sierra Leone 100

3.26 Africa Refining Industry, Recent Developments 101

3.27 Africa Refining Industry, Recent Contracts 104

4. Asia Refining Industry 106

4.1 Asia Refining Industry, Snapshot 106

4.2 Asia Refining Industry, Planned and Announced Refineries, Capacity Expansions and Capex by Country 113

4.3 Asia Refining Industry, New Units and Capacity Expansions by Country 118

4.4 Asia Refining Industry, China 126

4.5 Asia Refining Industry, India 166

4.6 Asia Refining Industry, South Korea 173

4.7 Asia Refining Industry, Japan 177

4.8 Asia Refining Industry, Thailand 183

4.9 Asia Refining Industry, Singapore 186

4.10 Asia Refining Industry, Indonesia 188

4.11 Asia Refining Industry, Taiwan 192

4.12 Asia Refining Industry, Malaysia 194

4.13 Asia Refining Industry, Pakistan 197

4.14 Asia Refining Industry, Vietnam 202

4.15 Asia Refining Industry, Philippines 205

4.16 Asia Refining Industry, Brunei 207

4.17 Asia Refining Industry, North Korea 209

4.18 Asia Refining Industry, Myanmar 210

4.19 Asia Refining Industry, Bangladesh 213

4.20 Asia Refining Industry, Sri Lanka 216

4.21 Asia Refining Industry, Laos 218

4.22 Asia Refining Industry, Afghanistan 219

4.23 Asia Refining Industry, Recent Developments 220

4.24 Asia Refining Industry, Recent Contracts 223

5. Caribbean Refining Industry 226

5.1 Caribbean Refining Industry, Snapshot 226

5.2 Caribbean Refining Industry, Planned and Announced Refineries, Capacity Expansions and Capex by Country 232

5.3 Caribbean Refining Industry, New Units and Capacity Expansions by Key Countries 233

5.4 Caribbean Refining Industry, Curacao 233

5.5 Caribbean Refining Industry, Aruba 235

5.6 Caribbean Refining Industry, U.S. Virgin Islands 236

5.7 Caribbean Refining Industry, Trinidad and Tobago 238

5.8 Caribbean Refining Industry, Cuba 240

5.9 Caribbean Refining Industry, Dominican Republic 241

5.10 Caribbean Refining Industry, Jamaica 242

5.11 Caribbean Refining Industry, Martinique 243

6. Central America Refining Industry 244

6.1 Central America Refining Industry, Snapshot 244

6.2 Central America Refining Industry, Planned and Announced Refineries, Capacity Expansions and Capex by Country 247

6.3 Central America Refining Industry, New Units and Capacity Expansions by Country 248

6.4 Central America Refining Industry, Costa Rica 248

6.5 Central America Refining Industry, Nicaragua 249

6.6 Central America Refining Industry, Guatemala 250

7. Europe Refining Industry 251

7.1 Europe Refining Industry, Snapshot 251

7.2 Europe Refining Industry, Planned and Announced Refineries, Capacity Expansions and Capex by Country 258

7.3 Europe Refining Industry, Annual New Build and Expansion Capital Expenditure Outlook for Refineries by Key Countries 259

7.4 Europe Refining Industry, New Units and Capacity Expansions by Key Countries 260

7.5 Europe Refining Industry, Germany 261

7.6 Europe Refining Industry, Italy 265

7.7 Europe Refining Industry, Spain 268

7.8 Europe Refining Industry, Netherlands 272

7.9 Europe Refining Industry, United Kingdom 275

7.10 Europe Refining Industry, France 278

7.11 Europe Refining Industry, Belgium 280

7.12 Europe Refining Industry, Poland 282

7.13 Europe Refining Industry, Greece 284

7.14 Europe Refining Industry, Sweden 286

7.15 Europe Refining Industry, Romania 288

7.16 Europe Refining Industry, Bulgaria 290

7.17 Europe Refining Industry, Norway 292

7.18 Europe Refining Industry, Portugal 294

7.19 Europe Refining Industry, Finland 296

7.20 Europe Refining Industry, Austria 298

7.21 Europe Refining Industry, Denmark 299

7.22 Europe Refining Industry, Czech Republic 301

7.23 Europe Refining Industry, Hungary 303

7.24 Europe Refining Industry, Serbia 305

7.25 Europe Refining Industry, Slovakia 307

7.26 Europe Refining Industry, Croatia 309

7.27 Europe Refining Industry, Ireland 311

7.28 Europe Refining Industry, Switzerland 312

7.29 Europe Refining Industry, Bosnia and Herzegovina 313

7.30 Europe Refining Industry, Albania 314

7.31 Europe Refining Industry, Recent Developments 315

7.32 Europe Refining Industry, Recent Contracts 317

8. Former Soviet Union Refining Industry 319

8.1 FSU Refining Industry, Snapshot 319

8.2 FSU Refining Industry, Planned and Announced Refineries, Capacity Expansions and Capex by Country 326

8.3 FSU Refining Industry, New Units and Capacity Expansions by Key Countries 329

8.4 FSU Refining Industry, Russia 333

8.5 FSU Refining Industry, Belarus 343

8.6 FSU Refining Industry, Ukraine 345

8.7 FSU Refining Industry, Turkmenistan 346

8.8 FSU Refining Industry, Kazakhstan 348

8.9 FSU Refining Industry, Uzbekistan 351

8.10 FSU Refining Industry, Lithuania 353

8.11 FSU Refining Industry, Azerbaijan 354

8.12 FSU Refining Industry, Kyrgyzstan 356

8.13 FSU Refining Industry, Tajikistan 357

8.14 FSU Refining Industry, Georgia 358

8.15 FSU Refining Industry, Moldova 360

8.16 FSU Refining Industry, Recent Developments 361

8.17 FSU Refining Industry, Recent Contracts 363

9. Middle East Refining Industry 365

9.1 Middle East Refining Industry, Snapshot 365

9.2 Middle East Refining Industry, Planned and Announced Refineries, Capacity Expansions and Capex by Country 372

9.3 Middle East Refining Industry, New Units and Capacity Expansions by Key Countries 377

9.4 Middle East Refining Industry, Saudi Arabia 383

9.5 Middle East Refining Industry, Iran 387

9.6 Middle East Refining Industry, United Arab Emirates 393

9.7 Middle East Refining Industry, Kuwait 397

9.8 Middle East Refining Industry, Iraq 399

9.9 Middle East Refining Industry, Turkey 404

9.10 Middle East Refining Industry, Qatar 407

9.11 Middle East Refining Industry, Israel 409

9.12 Middle East Refining Industry, Oman 411

9.13 Middle East Refining Industry, Bahrain 414

9.14 Middle East Refining Industry, Syria 416

9.15 Middle East Refining Industry, Yemen 417

9.16 Middle East Refining Industry, Jordan 418

9.17 Middle East Refining Industry, Recent Developments 420

9.18 Middle East Refining Industry, Recent Contracts 424

10. North America Refining Industry 427

10.1 North America Refining Industry, Snapshot 427

10.2 North America Refining Industry, Planned and Announced Refineries, Capacity Expansions and Capex by Country 436

10.3 North America Refining Industry, New Units and Capacity Expansions by Country 439

10.4 Refining Industry in the US, Gulf Coast (PADD 3) 443

10.5 Refining Industry in the US, Midwest (PADD 2) 455

10.6 Refining Industry in the US, West Coast (PADD 5) 462

10.7 Refining Industry in the US, East Coast (PADD 1) 467

10.8 Refining Industry in the US, Rocky Mountain (PADD 4) 470

10.9 North America Refining Industry, Canada 475

10.10 North America Refining Industry, Mexico 480

10.11 North America Refining Industry, Recent Developments 483

10.12 North America Refining Industry, Recent Contracts 486

11. Oceania Refining Industry 488

11.1 Oceania Refining Industry, Snapshot 488

11.2 Oceania Refining Industry, Planned and Announced Refineries, Capacity Expansions and Capex by Country 494

11.3 Oceania Refining Industry, New Units and Capacity Expansions by Key Countries 497

11.4 Oceania Refining Industry, Australia 498

11.5 Oceania Refining Industry, New Zealand 500

11.6 Oceania Refining Industry, Papua New Guinea 501

11.7 Oceania Refining Industry, Recent Developments 502

11.8 Oceania Refining Industry, Recent Contracts 502

12. South America Refining Industry 503

12.1 South America Refining Industry, Snapshot 503

12.2 South America Refining Industry, Planned and Announced Refineries, Capacity Expansions and Capex by Country 509

12.3 South America Refining Industry, New Units and Capacity Expansions by Country 512

12.4 South America Refining Industry, Brazil 516

12.5 South America Refining Industry, Venezuela 520

12.6 South America Refining Industry, Argentina 523

12.7 South America Refining Industry, Colombia 526

12.8 South America Refining Industry, Peru 529

12.9 South America Refining Industry, Chile 531

12.10 South America Refining Industry, Ecuador 533

12.11 South America Refining Industry, Bolivia 534

12.12 Africa Refining Industry, Uruguay 535

12.13 Africa Refining Industry, Suriname 536

12.14 Africa Refining Industry, Paraguay 537

12.15 South America Refining Industry, Recent Developments 538

12.16 South America Refining Industry, Recent Contracts 540

13. Appendix 542

13.1 Abbreviations 542

13.2 Status Definition 542

13.3 States by PADD Regions Included in the Report 543

13.4 Methodology 543

About GlobalData 544

Contact Us 545

Table

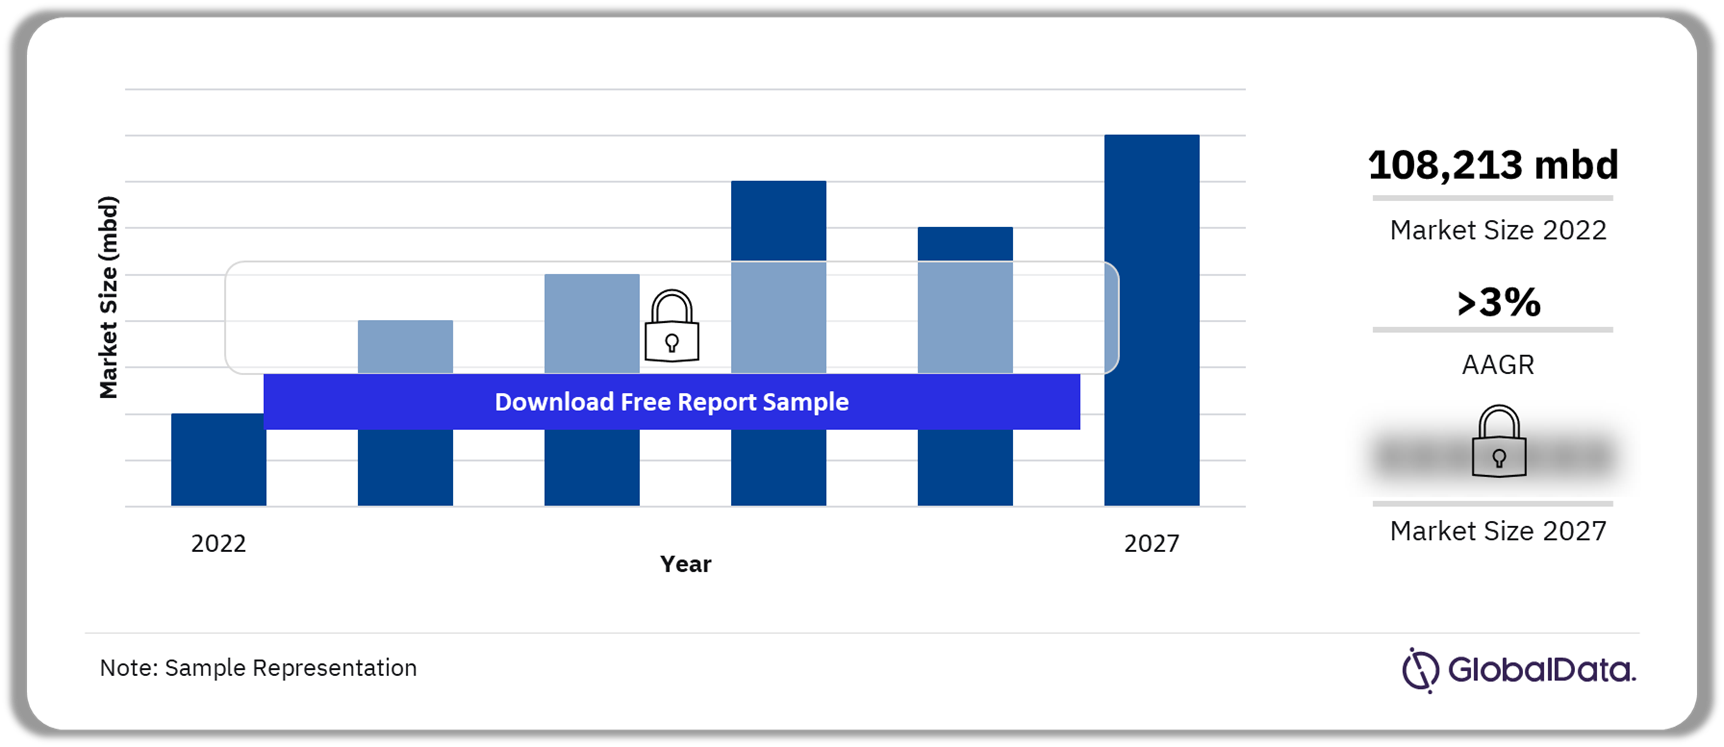
Table 1: Refining industry, Global, key statistics, 2022 25

Table 2: Refining industry, Global, refining capacity by key countries (mbd), 2017–2027 25

Table 3: Refining industry, Global, crude distillation unit capacity by key countries (mbd), 2017–2027 27

Table 4: Refining industry, Global, condensate splitter unit capacity by key countries (mbd), 2017–2027 28

Table 5: Refining industry, Global, coking unit capacity by key countries (mbd), 2017–2027 29

Table 6: Refining industry, Global, catalytic cracker unit capacity by key countries (mbd), 2017–2027 30

Table 7: Refining industry, Global, hydrocracking unit capacity by key countries (mbd), 2017–2027 31

Table 8: Refining industry, Global, top 10 planned and announced refineries, 2023–2027 32

Table 9: Global, annual new build and expansion capital expenditure outlook for refineries ($B), 2023–2027 33

Table 10: Refining industry, Global, annual new build and expansion capital expenditure outlook for refineries by key countries ($M), 2023–2027 34

Table 11: Refining industry, Global, crude distillation unit capacity additions through new and existing refinery expansions by region (mbd), 2023–2027 35

Table 12: Refining industry, Global, crude distillation unit capacity additions through new refineries by region (mbd), 2023–2027 35

Table 13: Refining Industry, Global, crude distillation unit capacity Additions through unit expansions by region (mbd), 2023–2027 36

Table 14: Refining industry, Global, condensate splitter unit capacity additions through new and existing refinery expansions by region (mbd), 2023–2027 37

Table 15: Refining industry, Global, condensate splitter unit capacity additions through new refineries by region (mbd), 2023–2027 37

Table 16: Refining industry, Global, condensate splitter unit capacity additions through existing refinery expansions by region (mbd), 2023–2027 38

Table 17: Refining industry, Global, coking unit capacity additions through new and existing refinery expansions by region (mbd), 2023–2027 39

Table 18: Refining industry, Global, coking unit capacity additions through new refineries by region (mbd), 2023–2027 39

Table 19: Refining industry, Global, coking unit capacity additions through existing refinery expansions by region (mbd), 2023–2027 40

Table 20: Refining industry, Global, catalytic cracker unit capacity additions through new and existing refinery expansions by region (mbd), 2023–2027 41

Table 21: Refining industry, Global, catalytic cracker unit capacity additions through new refineries by region (mbd), 2023–2027 41

Table 22: Refining industry, Global, catalytic cracker unit capacity additions through existing refinery expansions by region (mbd), 2023–2027 42

Table 23: Refining industry, Global, hydrocracking unit capacity additions through new and existing refinery expansions by region (mbd), 2023–2027 43

Table 24: Refining industry, Global, hydrocracking unit capacity additions through new refineries by region (mbd), 2023–2027 43

Table 25: Refining industry, Global, hydrocracking unit capacity additions through existing refinery expansions by region (mbd), 2023–2027 44

Table 26: Refining industry, Global, contribution (%) to global refining capacity, 2017–2027 45

Table 27: Refining industry, Africa, key statistics, 2022 48

Table 28: Refining industry, Africa, refining capacity by key countries (mbd), 2017–2027 49

Table 29: Refining industry, Africa, crude distillation unit capacity by key countries (mbd), 2017–2027 50

Table 30: Refining industry, Africa, condensate splitter unit capacity by key countries (mbd), 2017–2027 51

Table 31: Refining industry, Africa, coking unit capacity by country (mbd), 2017–2027 52

Table 32: Refining industry, Africa, catalytic cracker unit capacity by key countries (mbd), 2017–2027 53

Table 33: Refining industry, Africa, hydrocracking unit capacity by key countries (mbd), 2017–2027 54

Table 34: Refining industry, Africa, planned and announced refineries, 2023–2027 55

Table 35: Africa, annual new build and expansion capital expenditure outlook for refineries ($B), 2023–2027 58

Table 36: Africa, annual new build and expansion capital expenditure outlook for refineries by key countries ($M), 2023–2027 59

Table 37: Refining industry, Africa, crude distillation unit capacity additions through new and existing refinery expansions by key countries (mbd), 2023–2027 60

Table 38: Refining industry, Africa, crude distillation unit capacity additions through new refineries by key countries (mbd), 2023–2027 60

Table 39: Refining Industry, Africa, crude distillation unit capacity Additions through unit expansions by key countries (mbd), 2023–2027 61

Table 40: Refining industry, Africa, condensate splitter unit capacity additions through new and existing refinery expansions by country (mbd), 2023–2027 62

Table 41: Refining industry, Africa, condensate splitter unit capacity additions through new refineries by country (mbd), 2023–2027 62

Table 42: Refining Industry, Africa, condensate splitter unit capacity Additions through existing refinery expansions by country (mbd), 2023–2027 62

Table 43: Refining industry, Africa, coking unit capacity additions through new refineries by country (mbd), 2023–2027 63

Table 44: Refining industry, Africa, catalytic cracker unit capacity additions through new refineries by key countries (mbd), 2023–2027 63

Table 45: Refining industry, Africa, hydrocracking unit capacity additions through new and existing refinery expansions by key countries (mbd), 2023–2027 64

Table 46: Refining industry, Africa, hydrocracking unit capacity additions through new refineries by key countries (mbd), 2023–2027 64

Table 47: Refining Industry, Africa, hydrocracking unit capacity Additions through existing refinery expansions by country (mbd), 2023–2027 65

Table 48: Refining industry, Egypt, crude distillation unit capacity (mbd), 2017–2027 66

Table 49: Refining industry, Egypt, condensate splitter unit capacity (mbd), 2017–2027 67

Table 50: Refining industry, Egypt, coking unit capacity (mbd), 2017–2027 67

Table 51: Refining industry, Egypt, catalytic cracker unit capacity (mbd), 2017–2027 68

Table 52: Refining industry, Egypt, hydrocracking unit capacity (mbd), 2017–2027 69

Table 53: Refining industry, Algeria, crude distillation unit capacity (mbd), 2017–2027 70

Table 54: Refining industry, Algeria, condensate splitter unit capacity (mbd), 2017–2027 70

Table 55: Refining industry, Algeria, catalytic cracker unit capacity (mbd), 2017–2027 71

Table 56: Refining industry, Algeria, hydrocracking unit capacity (mbd), 2017–2027 71

Table 57: Refining industry, South Africa, crude distillation unit capacity (mbd), 2017–2027 72

Table 58: Refining industry, South Africa, condensate splitter unit capacity (mbd), 2017–2027 72

Table 59: Refining industry, South Africa, catalytic cracker unit capacity (mbd), 2017–2027 73

Table 60: Refining industry, South Africa, hydrocracking unit capacity (mbd), 2017–2027 73

Table 61: Refining industry, Nigeria, crude distillation unit capacity (mbd), 2017–2027 74

Table 62: Refining industry, Nigeria, condensate splitter unit capacity (mbd), 2017–2027 76

Table 63: Refining industry, Nigeria, catalytic cracker unit capacity (mbd), 2017–2027 77

Table 64: Refining industry, Nigeria, hydrocracking unit capacity (mbd), 2017–2027 77

Table 65: Refining industry, Libya, crude distillation unit capacity (mbd), 2017–2027 78

Table 66: Refining industry, Morocco, crude distillation unit capacity (mbd), 2017–2027 79

Table 67: Refining industry, Morocco, hydrocracking unit capacity (mbd), 2017–2027 79

Table 68: Refining industry, Sudan, crude distillation unit capacity (mbd), 2017–2027 80

Table 69: Refining industry, Sudan, coking unit capacity (mbd), 2017–2027 81

Table 70: Refining industry, Sudan, catalytic cracker unit capacity (mbd), 2017–2027 81

Table 71: Refining industry, Sudan, hydrocracking unit capacity (mbd), 2017–2027 82

Table 72: Refining industry, Angola, crude distillation unit capacity (mbd), 2017–2027 83

Table 73: Refining industry, Angola, catalytic cracker unit capacity (mbd), 2017–2027 84

Table 74: Refining industry, Angola, hydrocracking unit capacity (mbd), 2017–2027 84

Table 75: Refining industry, Cote d’Ivoire, crude distillation unit capacity (mbd), 2017–2027 85

Table 76: Refining industry, Cote d’Ivoire, hydrocracking unit capacity (mbd), 2017–2027 85

Table 77: Refining industry, Cameroon, crude distillation unit capacity (mbd), 2017–2027 86

Table 78: Refining industry, Cameroon, condensate splitter unit capacity (mbd), 2017–2027 86

Table 79: Refining industry, Ghana, crude distillation unit capacity (mbd), 2017–2027 87

Table 80: Refining industry, Ghana, catalytic cracker unit capacity (mbd), 2017–2027 87

Table 81: Refining industry, Djibouti, crude distillation unit capacity (mbd), 2017–2027 88

Table 82: Refining industry, Djibouti, catalytic cracker unit capacity (mbd), 2017–2027 88

Table 83: Refining industry, Djibouti, hydrocracking unit capacity (mbd), 2017–2027 89

Table 84: Refining industry, Tunisia, crude distillation unit capacity (mbd), 2017–2027 90

Table 85: Refining industry, Gabon, crude distillation unit capacity (mbd), 2017–2027 91

Table 86: Refining industry, Zambia, crude distillation unit capacity (mbd), 2017–2027 92

Table 87: Refining industry, Senegal, crude distillation unit capacity (mbd), 2017–2027 93

Table 88: Refining industry, Niger, crude distillation unit capacity (mbd), 2017–2027 94

Table 89: Refining industry, Niger, catalytic cracker unit capacity (mbd), 2017–2027 94

Table 90: Refining industry, Chad, crude distillation unit capacity (mbd), 2017–2027 95

Table 91: Refining industry, Congo Republic, crude distillation unit capacity (mbd), 2017–2027 96

Table 92: Refining industry, Congo Republic, catalytic cracker unit capacity (mbd), 2017–2027 96

Table 93: Refining industry, Congo Republic, hydrocracking unit capacity (mbd), 2017–2027 97

Table 94: Refining industry, South Sudan, crude distillation unit capacity (mbd), 2017–2027 98

Table 95: Refining industry, Liberia, crude distillation unit capacity (mbd), 2017–2027 99

Table 96: Refining industry, Sierra Leone, crude distillation unit capacity (mbd), 2017–2027 100

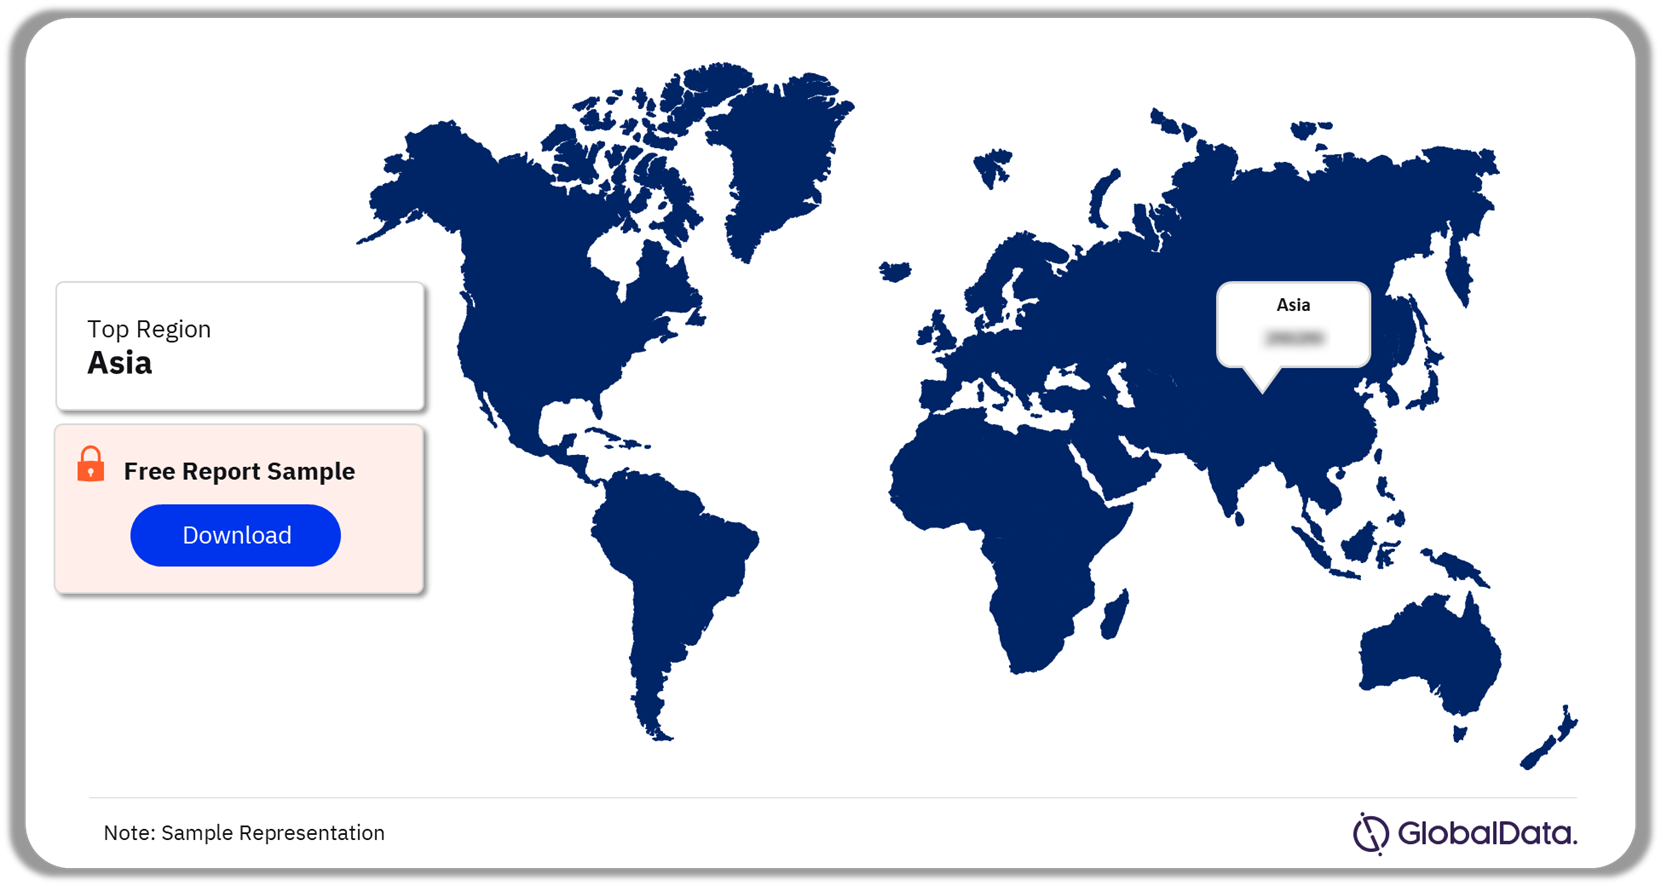
Table 97: Refining industry, Asia, key statistics, 2022 106

Table 98: Refining industry, Asia, refining capacity by key countries (mbd), 2017–2027 107

Table 99: Refining industry, Asia, crude distillation unit capacity by key countries (mbd), 2017–2027 108

Table 100: Refining industry, Asia, condensate splitter unit capacity by key countries (mbd), 2017–2027 109

Table 101: Refining industry, Asia, coking unit capacity by key countries (mbd), 2017–2027 110

Table 102: Refining industry, Asia, catalytic cracker unit capacity by key countries (mbd), 2017–2027 111

Table 103: Refining industry, Asia, hydrocracking unit capacity by key countries (mbd), 2017–2027 112

Table 104: Refining industry, Asia, planned and announced refineries, 2023–2027 113

Table 105: Asia, annual new build and expansion capital expenditure outlook for refineries ($B), 2023–2027 116

Table 106: Asia, annual new build and expansion capital expenditure outlook for refineries by key countries ($M), 2023–2027 117

Table 107: Refining industry, Asia, crude distillation unit capacity additions through new and existing refinery expansions by key countries (mbd), 2023–2027 118

Table 108: Refining industry, Asia, crude distillation unit capacity additions through new refineries by key countries (mbd), 2023–2027 118

Table 109: Refining Industry, Asia, crude distillation unit capacity Additions through unit expansions by key countries (mbd), 2023–2027 119

Table 110: Refining industry, Asia, Condensate Splitter unit capacity additions through new refineries by country (mbd), 2023–2027 119

Table 111: Refining industry, Asia, coking unit capacity additions through new refineries by country (mbd), 2023–2027 120

Table 112: Refining industry, Asia, coking unit capacity additions through new refineries by country (mbd), 2023–2027 120

Table 113: Refining Industry, Asia, coking unit capacity Additions through unit expansions by country (mbd), 2023–2027 121

Table 114: Refining industry, Asia, catalytic cracker unit capacity additions through new refineries by key countries (mbd), 2023–2027 122

Table 115: Refining industry, Asia, catalytic cracker unit capacity additions through new refineries by key countries (mbd), 2023–2027 122

Table 116: Refining Industry, Asia, catalytic cracker unit capacity Additions through unit expansions by country (mbd), 2023–2027 123

Table 117: Refining industry, Asia, hydrocracking unit capacity additions through new and existing refinery expansions by key countries (mbd), 2023–2027 123

Table 118: Refining industry, Asia, hydrocracking unit capacity additions through new refineries by key countries (mbd), 2023–2027 124

Table 119: Refining Industry, Asia, hydrocracking unit capacity Additions through unit expansions by country (mbd), 2023–2027 125

Table 120: Refining industry, China, crude distillation unit capacity (mbd), 2017–2027 126

Table 121: Refining industry, China, condensate splitter unit capacity (mbd), 2017–2027 142

Table 122: Refining industry, China, coking unit capacity (mbd), 2017–2027 143

Table 123: Refining industry, China, catalytic cracker unit capacity (mbd), 2017–2027 149

Table 124: Refining industry, China, hydrocracking unit capacity (mbd), 2017–2027 161

Table 125: Refining industry, India, crude distillation unit capacity (mbd), 2017–2027 166

Table 126: Refining industry, India, coking unit capacity (mbd), 2017–2027 168

Table 127: Refining industry, India, coking unit capacity (mbd), 2017–2027 170

Table 128: Refining industry, India, catalytic cracker unit capacity (mbd), 2017–2027 172

Table 129: Refining industry, South Korea, crude distillation unit capacity (mbd), 2017–2027 173

Table 130: Refining industry, South Korea, condensate splitter unit capacity (mbd), 2017–2027 174

Table 131: Refining industry, South Korea, coking unit capacity (mbd), 2017–2027 174

Table 132: Refining industry, South Korea, catalytic cracker unit capacity (mbd), 2017–2027 175

Table 133: Refining industry, South Korea, hydrocracking unit capacity (mbd), 2017–2027 176

Table 134: Refining industry, Japan, crude distillation unit capacity (mbd), 2017–2027 177

Table 135: Refining industry, Japan, condensate splitter unit capacity (mbd), 2017–2027 178

Table 136: Refining industry, Japan, coking unit capacity (mbd), 2017–2027 179

Table 137: Refining industry, Japan, catalytic cracker unit capacity (mbd), 2017–2027 180

Table 138: Refining industry, Japan, hydrocracking unit capacity (mbd), 2017–2027 182

Table 139: Refining industry, Thailand, crude distillation unit capacity (mbd), 2017–2027 183

Table 140: Refining industry, Thailand, condensate splitter unit capacity (mbd), 2017–2027 184

Table 141: Refining industry, Thailand, catalytic cracker unit capacity (mbd), 2017–2027 184

Table 142: Refining industry, Thailand, hydrocracking unit capacity (mbd), 2017–2027 185

Table 143: Refining industry, Singapore, crude distillation unit capacity (mbd), 2017–2027 186

Table 144: Refining industry, Singapore, condensate splitter unit capacity (mbd), 2017–2027 186

Table 145: Refining industry, Singapore, catalytic cracker unit capacity (mbd), 2017–2027 187

Table 146: Refining industry, Singapore, hydrocracking unit capacity (mbd), 2017–2027 187

Table 147: Refining industry, Indonesia, crude distillation unit capacity (mbd), 2017–2027 188

Table 148: Refining industry, Indonesia, condensate splitter unit capacity (mbd), 2017–2027 189

Table 149: Refining industry, Indonesia, coking unit capacity (mbd), 2017–2027 189

Table 150: Refining industry, Indonesia, catalytic cracker unit capacity (mbd), 2017–2027 190

Table 151: Refining industry, Indonesia, hydrocracking unit capacity (mbd), 2017–2027 191

Table 152: Refining industry, Taiwan, crude distillation unit capacity (mbd), 2017–2027 192

Table 153: Refining industry, Taiwan, condensate splitter unit capacity (mbd), 2017–2027 192

Table 154: Refining industry, Taiwan, coking unit capacity (mbd), 2017–2027 193

Table 155: Refining industry, Taiwan, catalytic cracker unit capacity (mbd), 2017–2027 193

Table 156: Refining industry, Taiwan, hydrocracking unit capacity (mbd), 2017–2027 193

Table 157: Refining industry, Malaysia, crude distillation unit capacity (mbd), 2017–2027 194

Table 158: Refining industry, Malaysia, condensate splitter unit capacity (mbd), 2017–2027 195

Table 159: Refining industry, Malaysia, coking unit capacity (mbd), 2017–2027 195

Table 160: Refining industry, Malaysia, catalytic cracker unit capacity (mbd), 2017–2027 196

Table 161: Refining industry, Malaysia, hydrocracking unit capacity (mbd), 2017–2027 196

Table 162: Refining industry, Pakistan, crude distillation unit capacity (mbd), 2017–2027 197

Table 163: Refining industry, Pakistan, condensate splitter unit capacity (mbd), 2017–2027 198

Table 164: Refining industry, Pakistan, coking unit capacity (mbd), 2017–2027 199

Table 165: Refining industry, Pakistan, catalytic cracker unit capacity (mbd), 2017–2027 200

Table 166: Refining industry, Pakistan, hydrocracking unit capacity (mbd), 2017–2027 201

Table 167: Refining industry, Vietnam, crude distillation unit capacity (mbd), 2017–2027 202

Table 168: Refining industry, Vietnam, condensate splitter unit capacity (mbd), 2017–2027 203

Table 169: Refining industry, Vietnam, catalytic cracker unit capacity (mbd), 2017–2027 203

Table 170: Refining industry, Vietnam, hydrocracking unit capacity (mbd), 2017–2027 204

Table 171: Refining industry, Philippines, crude distillation unit capacity (mbd), 2017–2027 205

Table 172: Refining industry, Philippines, coking unit capacity (mbd), 2017–2027 205

Table 173: Refining industry, Philippines, catalytic cracker unit capacity (mbd), 2017–2027 206

Table 174: Refining industry, Philippines, hydrocracking unit capacity (mbd), 2017–2027 206

Table 175: Refining industry, Brunei, crude distillation unit capacity (mbd), 2017–2027 207

Table 176: Refining industry, Brunei, coking unit capacity (mbd), 2017–2027 207

Table 177: Refining industry, Brunei, hydrocracking unit capacity (mbd), 2017–2027 208

Table 178: Refining industry, North Korea, crude distillation unit capacity (mbd), 2017–2027 209

Table 179: Refining industry, North Korea, catalytic cracker unit capacity (mbd), 2017–2027 209

Table 180: Refining industry, Myanmar, crude distillation unit capacity (mbd), 2017–2027 210

Table 181: Refining industry, Myanmar, coking unit capacity (mbd), 2017–2027 211

Table 182: Refining industry, Myanmar, catalytic cracker unit capacity (mbd), 2017–2027 211

Table 183: Refining industry, Myanmar, hydrocracking unit capacity (mbd), 2017–2027 212

Table 184: Refining industry, Bangladesh, crude distillation unit capacity (mbd), 2017–2027 213

Table 185: Refining industry, Bangladesh, condensate splitter unit capacity (mbd), 2017–2027 214

Table 186: Refining industry, Bangladesh, catalytic cracker unit capacity (mbd), 2017–2027 215

Table 187: Refining industry, Bangladesh, hydrocracking unit capacity (mbd), 2017–2027 215

Table 188: Refining industry, Sri Lanka, crude distillation unit capacity (mbd), 2017–2027 216

Table 189: Refining industry, Sri Lanka, coking unit capacity (mbd), 2017–2027 216

Table 190: Refining industry, Sri Lanka, catalytic cracker unit capacity (mbd), 2017–2027 217

Table 191: Refining industry, Sri Lanka, hydrocracking unit capacity (mbd), 2017–2027 217

Table 192: Refining industry, Laos, crude distillation unit capacity (mbd), 2017–2027 218

Table 193: Refining industry, Afghanistan, crude distillation unit capacity (mbd), 2017–2027 219

Table 194: Refining industry, Caribbean, key statistics, 2022 226

Table 195: Refining industry, Caribbean, refining capacity by key countries (mbd), 2017–2027 227

Table 196: Refining industry, Caribbean, crude distillation unit capacity by key countries (mbd), 2017–2027 228

Table 197: Refining industry, Caribbean, coking unit capacity by country (mbd), 2017–2027 229

Table 198: Refining industry, Caribbean, catalytic cracker unit capacity by country (mbd), 2017–2027 230

Table 199: Refining industry, Caribbean, hydrocracking unit capacity by country (mbd), 2017–2027 231

Table 200: Refining industry, Curacao, crude distillation unit capacity (mbd), 2017–2027 233

Table 201: Refining industry, Curacao, catalytic cracker unit capacity (mbd), 2017–2027 233

Table 202: Refining industry, Curacao, hydrocracking unit capacity (mbd), 2017–2027 234

Table 203: Refining industry, Aruba, crude distillation unit capacity (mbd), 2017–2027 235

Table 204: Refining industry, Aruba, coking unit capacity (mbd), 2017–2027 235

Table 205: Refining industry, U.S. Virgin Islands, crude distillation unit capacity (mbd), 2017–2027 236

Table 206: Refining industry, U.S. Virgin Islands, crude distillation unit capacity (mbd), 2017–2027 236

Table 207: Refining industry, U.S. Virgin Islands, catalytic cracker unit capacity (mbd), 2017–2027 237

Table 208: Refining industry, Trinidad and Tobago, crude distillation unit capacity (mbd), 2017–2027 238

Table 209: Refining industry, Trinidad and Tobago, catalytic cracker unit capacity (mbd), 2017–2027 238

Table 210: Refining industry, Trinidad and Tobago, hydrocracking unit capacity (mbd), 2017–2027 239

Table 211: Refining industry, Cuba, crude distillation unit capacity (mbd), 2017–2027 240

Table 212: Refining industry, Cuba, catalytic cracker unit capacity (mbd), 2017–2027 240

Table 213: Refining industry, Dominican Republic, crude distillation unit capacity (mbd), 2017–2027 241

Table 214: Refining industry, Jamaica, crude distillation unit capacity (mbd), 2017–2027 242

Table 215: Refining industry, Martinique, crude distillation unit capacity (mbd), 2017–2027 243

Table 216: Refining industry, Central America, key statistics, 2022 244

Table 217: Refining industry, Central America, refining capacity by country (mbd), 2017–2027 245

Table 218: Refining industry, Central America, crude distillation unit capacity by country (mbd), 2017–2027 246

Table 219: Refining industry, Costa Rica, crude distillation unit capacity (mbd), 2017–2027 248

Table 220: Refining industry, Nicaragua, crude distillation unit capacity (mbd), 2017–2027 249

Table 221: Refining industry, Guatemala, crude distillation unit capacity (mbd), 2017–2027 250

Table 222: Refining industry, Europe, key statistics, 2022 251

Table 223: Refining industry, Europe, refining capacity by key countries (mbd), 2017–2027 252

Table 224: Refining industry, Europe, crude distillation unit capacity by key countries (mbd), 2017–2027 253

Table 225: Refining industry, Europe, condensate splitter unit capacity by country (mbd), 2017–2027 254

Table 226: Refining industry, Europe, coking unit capacity by key countries (mbd), 2017–2027 255

Table 227: Refining industry, Europe, catalytic cracker unit capacity by key countries (mbd), 2017–2027 256

Table 228: Refining industry, Europe, hydrocracking unit capacity by key countries (mbd), 2017–2027 257

Table 229: Europe, annual new build and expansion capital expenditure outlook for refineries ($M), 2023–2027 258

Table 230: Europe, annual new build and expansion capital expenditure outlook for refineries by country ($M), 2023–2027 259

Table 231: Refining industry, Europe, coking unit capacity additions through new refineries by country (mbd), 2023–2027 260

Table 232: Refining industry, Europe, hydrocracking unit capacity additions through existing refinery expansions by country (mbd), 2023–2027 260

Table 233: Refining industry, Germany, crude distillation unit capacity (mbd), 2017–2027 261

Table 234: Refining industry, Germany, coking unit capacity (mbd), 2017–2027 262

Table 235: Refining industry, Germany, catalytic cracker unit capacity (mbd), 2017–2027 263

Table 236: Refining industry, Germany, hydrocracking unit capacity (mbd), 2017–2027 264

Table 237: Refining industry, Italy, crude distillation unit capacity (mbd), 2017–2027 265

Table 238: Refining industry, Italy, catalytic cracker unit capacity (mbd), 2017–2027 266

Table 239: Refining industry, Italy, hydrocracking unit capacity (mbd), 2017–2027 267

Table 240: Refining industry, Spain, crude distillation unit capacity (mbd), 2017–2027 268

Table 241: Refining industry, Spain, coking unit capacity (mbd), 2017–2027 269

Table 242: Refining industry, Spain, catalytic cracker unit capacity (mbd), 2017–2027 270

Table 243: Refining industry, Spain, hydrocracking unit capacity (mbd), 2017–2027 271

Table 244: Refining industry, Netherlands, crude distillation unit capacity (mbd), 2017–2027 272

Table 245: Refining industry, Netherlands, condensate splitter unit capacity (mbd), 2017–2027 272

Table 246: Refining industry, Netherlands, coking unit capacity (mbd), 2017–2027 273

Table 247: Refining industry, Netherlands, catalytic cracker unit capacity (mbd), 2017–2027 273

Table 248: Refining industry, Netherlands, hydrocracking unit capacity (mbd), 2017–2027 274

Table 249: Refining industry, United Kingdom, crude distillation unit capacity (mbd), 2017–2027 275

Table 250: Refining industry, United Kingdom, coking unit capacity (mbd), 2017–2027 276

Table 251: Refining industry, United Kingdom, catalytic cracker unit capacity (mbd), 2017–2027 276

Table 252: Refining industry, United Kingdom, hydrocracking unit capacity (mbd), 2017–2027 277

Table 253: Refining industry, France, crude distillation unit capacity (mbd), 2017–2027 278

Table 254: Refining industry, France, catalytic cracker unit capacity (mbd), 2017–2027 279

Table 255: Refining industry, France, hydrocracking unit capacity (mbd), 2017–2027 279

Table 256: Refining industry, Belgium, crude distillation unit capacity (mbd), 2017–2027 280

Table 257: Refining industry, Belgium, coking unit capacity (mbd), 2017–2027 280

Table 258: Refining industry, Belgium, catalytic cracker unit capacity (mbd), 2017–2027 281

Table 259: Refining industry, Belgium, hydrocracking unit capacity (mbd), 2017–2027 281

Table 260: Refining industry, Poland, crude distillation unit capacity (mbd), 2017–2027 282

Table 261: Refining industry, Poland, coking unit capacity (mbd), 2017–2027 282

Table 262: Refining industry, Poland, catalytic cracker unit capacity (mbd), 2017–2027 283

Table 263: Refining industry, Poland, hydrocracking unit capacity (mbd), 2017–2027 283

Table 264: Refining industry, Greece, crude distillation unit capacity (mbd), 2017–2027 284

Table 265: Refining industry, Greece, catalytic cracker unit capacity (mbd), 2017–2027 284

Table 266: Refining industry, Greece, hydrocracking unit capacity (mbd), 2017–2027 285

Table 267: Refining industry, Sweden, crude distillation unit capacity (mbd), 2017–2027 286

Table 268: Refining industry, Sweden, coking unit capacity (mbd), 2017–2027 286

Table 269: Refining industry, Sweden, catalytic cracker unit capacity (mbd), 2017–2027 287

Table 270: Refining industry, Sweden, hydrocracking unit capacity (mbd), 2017–2027 287

Table 271: Refining industry, Romania, crude distillation unit capacity (mbd), 2017–2027 288

Table 272: Refining industry, Romania, coking unit capacity (mbd), 2017–2027 288

Table 273: Refining industry, Romania, catalytic cracker unit capacity (mbd), 2017–2027 289

Table 274: Refining industry, Romania, hydrocracking unit capacity (mbd), 2017–2027 289

Table 275: Refining industry, Bulgaria, crude distillation unit capacity (mbd), 2017–2027 290

Table 276: Refining industry, Bulgaria, catalytic cracker unit capacity (mbd), 2017–2027 290

Table 277: Refining industry, Bulgaria, hydrocracking unit capacity (mbd), 2017–2027 291

Table 278: Refining industry, Norway, crude distillation unit capacity (mbd), 2017–2027 292

Table 279: Refining industry, Norway, coking unit capacity (mbd), 2017–2027 292

Table 280: Refining industry, Norway, catalytic cracker unit capacity (mbd), 2017–2027 293

Table 281: Refining industry, Portugal, crude distillation unit capacity (mbd), 2017–2027 294

Table 282: Refining industry, Portugal, coking unit capacity (mbd), 2017–2027 294

Table 283: Refining industry, Portugal, catalytic cracker unit capacity (mbd), 2017–2027 295

Table 284: Refining industry, Portugal, hydrocracking unit capacity (mbd), 2017–2027 295

Table 285: Refining industry, Finland, crude distillation unit capacity (mbd), 2017–2027 296

Table 286: Refining industry, Finland, catalytic cracker unit capacity (mbd), 2017–2027 296

Table 287: Refining industry, Finland, hydrocracking unit capacity (mbd), 2017–2027 297

Table 288: Refining industry, Austria, crude distillation unit capacity (mbd), 2017–2027 298

Table 289: Refining industry, Austria, catalytic cracker unit capacity (mbd), 2017–2027 298

Table 290: Refining industry, Denmark, crude distillation unit capacity (mbd), 2017–2027 299

Table 291: Refining industry, Denmark, condensate splitter unit capacity (mbd), 2017–2027 299

Table 292: Refining industry, Denmark, coking unit capacity (mbd), 2017–2027 300

Table 293: Refining industry, Denmark, hydrocracking unit capacity (mbd), 2017–2027 300

Table 294: Refining industry, Czech Republic, crude distillation unit capacity (mbd), 2017–2027 301

Table 295: Refining industry, Czech Republic, catalytic cracker unit capacity (mbd), 2017–2027 301

Table 296: Refining industry, Czech Republic, hydrocracking unit capacity (mbd), 2017–2027 302

Table 297: Refining industry, Hungary, crude distillation unit capacity (mbd), 2017–2027 303

Table 298: Refining industry, Hungary, coking unit capacity (mbd), 2017–2027 303

Table 299: Refining industry, Hungary, catalytic cracker unit capacity (mbd), 2017–2027 303

Table 300: Refining industry, Hungary, hydrocracking unit capacity (mbd), 2017–2027 304

Table 301: Refining industry, Serbia, crude distillation unit capacity (mbd), 2017–2027 305

Table 302: Refining industry, Serbia, coking unit capacity (mbd), 2017–2027 305

Table 303: Refining industry, Serbia, catalytic cracker unit capacity (mbd), 2017–2027 306

Table 304: Refining industry, Serbia, hydrocracking unit capacity (mbd), 2017–2027 306

Table 305: Refining industry, Slovakia, crude distillation unit capacity (mbd), 2017–2027 307

Table 306: Refining industry, Slovakia, catalytic cracker unit capacity (mbd), 2017–2027 307

Table 307: Refining industry, Slovakia, hydrocracking unit capacity (mbd), 2017–2027 308

Table 308: Refining industry, Croatia, crude distillation unit capacity (mbd), 2017–2027 309

Table 309: Refining industry, Croatia, coking unit capacity (mbd), 2017–2027 309

Table 310: Refining industry, Croatia, catalytic cracker unit capacity (mbd), 2017–2027 310

Table 311: Refining industry, Croatia, hydrocracking unit capacity (mbd), 2017–2027 310

Table 312: Refining industry, Ireland, crude distillation unit capacity (mbd), 2017–2027 311

Table 313: Refining industry, Switzerland, crude distillation unit capacity (mbd), 2017–2027 312

Table 314: Refining industry, Bosnia and Herzegovina, crude distillation unit capacity (mbd), 2017–2027 313

Table 315: Refining industry, Albania, crude distillation unit capacity (mbd), 2017–2027 314

Table 316: Refining industry, Albania, coking unit capacity (mbd), 2017–2027 314

Table 317: Refining industry, FSU, key statistics, 2022 319

Table 318: Refining industry, FSU, refining capacity by key countries (mbd), 2017–2027 320

Table 319: Refining industry, FSU, crude distillation unit capacity by key countries (mbd), 2017–2027 321

Table 320: Refining industry, FSU, condensate splitter unit capacity by country (mbd), 2017–2027 322

Table 321: Refining industry, FSU, coking unit capacity by key countries (mbd), 2017–2027 323

Table 322: Refining industry, FSU, catalytic cracker unit capacity by key countries (mbd), 2017–2027 324

Table 323: Refining industry, FSU, hydrocracking unit capacity by country (mbd), 2017–2027 325

Table 324: Refining industry, FSU, planned and announced refineries, 2023–2027 326

Table 325: FSU, annual new build and expansion capital expenditure outlook for refineries ($M), 2023–2027 327

Table 326: FSU, annual new build and expansion capital expenditure outlook for refineries by country ($M), 2023–2027 328

Table 327: Refining industry, FSU, crude distillation unit capacity additions through new and existing refinery expansions by key countries (mbd), 2023–2027 329

Table 328: Refining industry, FSU, crude distillation unit capacity additions through new refineries by key countries (mbd), 2023–2027 329

Table 329: Refining Industry, FSU, crude distillation unit capacity additions through unit expansions by country (mbd), 2023–2027 330

Table 330: Refining industry, FSU, coking unit capacity additions through existing refinery expansions by country (mbd), 2023–2027 330

Table 331: Refining industry, FSU, catalytic cracker unit capacity additions through new and existing refinery expans

Figures

Figure 1: Refining industry, Global, refining capacity share vis-à-vis growth by key countries (%), 2017–2022 26

Figure 2: Refining industry, Global, crude distillation unit capacity market share vis-à-vis growth by key countries (%), 2017–2022 27

Figure 3: Refining industry, Global, condensate splitter unit capacity market share vis-à-vis growth by key countries (%), 2017–2022 28

Figure 4: Refining industry, Global, coking unit capacity market share vis-à-vis growth by key countries (%), 2017–2022 29

Figure 5: Refining industry, Global, catalytic cracker unit capacity market share vis-à-vis growth by key countries (%), 2017–2022 30

Figure 6: Refining industry, Global, hydrocracking unit capacity market share vis-à-vis growth by key countries (%), 2017–2022 31

Figure 7: Refining industry, Global, annual new build and expansion capital expenditure outlook for 33

refineries ($B), 2023–2027 33

Figure 8: Refining industry, Global, annual new build and expansion capital expenditure outlook for refineries by key countries ($M), 2023–2027 34

Figure 9: Refining industry, global regional comparison, contribution (%) to global refining capacity, 2017–2027 45

Figure 10: Refining industry, regional comparison, average nelson complexity index, 2022 46

Figure 11: Refining industry, regional comparison based on refining capacity growth, 2017–2027 47

Figure 12: Refining industry, Africa, refining capacity share vis-à-vis growth by key countries (%), 2017–2022 49

Figure 13: Refining industry, Africa, crude distillation unit capacity market share vis-à-vis growth by key countries (%), 2017–2022 50

Figure 14: Refining industry, Africa, condensate splitter unit capacity market share vis-à-vis growth by country (%), 2017–2022 51

Figure 15: Refining industry, Africa, coking unit capacity market share vis-à-vis growth by country (%), 2017–2022 52

Figure 16: Refining industry, Africa, catalytic cracker unit capacity market share vis-à-vis growth by key countries (%), 2017–2022 53

Figure 17: Refining industry, Africa, hydrocracking unit capacity market share vis-à-vis growth by key countries (%), 2017–2022 54

Figure 18: Refining industry, Africa, annual new build and expansion capital expenditure outlook for refineries ($B), 2023–2027 58

Figure 19: Refining industry, Africa, annual new build and expansion capital expenditure outlook for refineries by key countries, ($M), 2023–2027 59

Figure 20: Refining industry, Asia, refining capacity share vis-à-vis growth by key countries (%), 2017–2022 107

Figure 21: Refining industry, Asia, crude distillation unit capacity market share vis-à-vis growth by key countries (%), 2017–2022 108

Figure 22: Refining industry, Asia, condensate splitter unit capacity market share vis-à-vis growth by key countries (%), 2017–2022 109

Figure 23: Refining industry, Asia, coking unit capacity market share vis-à-vis growth by key countries (%), 2017–2022 110

Figure 24: Refining industry, Asia, catalytic cracker unit capacity market share vis-à-vis growth by key countries (%), 2017–2022 111

Figure 25: Refining industry, Asia, hydrocracking unit capacity market share vis-à-vis growth by key countries (%), 2017–2022 112

Figure 26: Refining industry, Asia, annual new build and expansion capital expenditure outlook for refineries ($B), 2023–2027 116

Figure 27: Refining industry, Asia, annual new build and expansion capital expenditure outlook for refineries by key countries, ($M), 2023–2027 117

Figure 28: Refining industry, Caribbean, refining capacity share vis-à-vis growth by key countries (%), 2017–2022 227

Figure 29: Refining industry, Caribbean, crude distillation unit capacity market share vis-à-vis growth by key countries (%), 2017–2022 228

Figure 30: Refining industry, Caribbean, coking unit capacity market share vis-à-vis growth by country (%), 2017–2022 229

Figure 31: Refining industry, Caribbean, catalytic cracker unit capacity market share vis-à-vis growth by country (%), 2017–2022 230

Figure 32: Refining industry, Caribbean, hydrocracking unit capacity market share vis-à-vis growth by country (%), 2017–2022 231

Figure 33: Refining industry, Central America, refining capacity share vis-à-vis growth by country (%), 2017–2022 245

Figure 34: Refining industry, Central America, crude distillation unit capacity market share vis-à-vis growth by country (%), 2017–2022 246

Figure 35: Refining industry, Europe, refining capacity share vis-à-vis growth by key countries (%), 2017–2022 252

Figure 36: Refining industry, Europe, crude distillation unit capacity market share vis-à-vis growth by key countries (%), 2017–2022 253

Figure 37: Refining industry, Europe, condensate splitter unit capacity market share vis-à-vis growth by country (%), 2017–2022 254

Figure 38: Refining industry, Europe, coking unit capacity market share vis-à-vis growth by key countries (%), 2017–2022 255

Figure 39: Refining industry, Europe, catalytic cracker unit capacity market share vis-à-vis growth by key countries (%), 2017–2022 256

Figure 40: Refining industry, Europe, hydrocracking unit capacity market share vis-à-vis growth by key countries (%), 2017–2022 257

Figure 41: Refining industry, Europe, annual new build and expansion capital expenditure outlook for refineries ($M), 2023–2027 258

Figure 42: Refining industry, Europe, annual new build and expansion capital expenditure outlook for refineries by key countries, ($M), 2023–2027 259

Figure 43: Refining industry, FSU, refining capacity share vis-à-vis growth by key countries (%), 2017–2022 320

Figure 44: Refining industry, FSU, crude distillation unit capacity market share vis-à-vis growth by key countries (%), 2017–2022 321

Figure 45: Refining industry, FSU, condensate splitter unit capacity market share vis-à-vis growth by country (%), 2017–2022 322

Figure 46: Refining industry, FSU, coking unit capacity market share vis-à-vis growth by key countries (%), 2017–2022 323

Figure 47: Refining industry, FSU, catalytic cracker unit capacity market share vis-à-vis growth by key countries (%), 2017–2022 324

Figure 48: Refining industry, FSU, hydrocracking unit capacity market share vis-à-vis growth by country (%), 2017–2022 325

Figure 49: Refining industry, FSU, annual new build and expansion capital expenditure outlook for refineries ($M), 2023–2027 327

Figure 50: Refining industry, FSU, annual new build and expansion capital expenditure outlook for refineries by key countries, ($M), 2023–2027 328

Figure 51: Refining industry, Middle East, refining capacity share vis-à-vis growth by key countries (%), 2017–2022 366

Figure 52: Refining industry, Middle East, crude distillation unit capacity market share vis-à-vis growth by key countries (%), 2017–2022 367

Figure 53: Refining industry, Middle East, condensate splitter unit capacity market share vis-à-vis growth by country (%), 2017–2022 368

Figure 54: Refining industry, Middle East, coking unit capacity market share vis-à-vis growth by key countries (%), 2017–2022 369

Figure 55: Refining industry, Middle East, catalytic cracker unit capacity market share vis-à-vis growth by key countries (%), 2017–2022 370

Figure 56: Refining industry, Middle East, hydrocracking unit capacity market share vis-à-vis growth by key countries (%), 2017–2022 371

Figure 57: Refining industry, Middle East, annual new build and expansion capital expenditure outlook for refineries ($B), 2023–2027 375

Figure 58: Refining industry, Middle East, annual new build and expansion capital expenditure outlook for refineries by key countries, ($M), 2023–2027 376

Figure 59: Refining industry, North America, refining capacity share vis-à-vis growth by country (%), 2017–2022 428

Figure 60: Refining industry, North America, crude distillation unit capacity market share vis-à-vis growth by country (%), 2017–2022 430

Figure 61: Refining industry, North America, condensate splitter unit capacity market share vis-à-vis growth by country (%), 2017–2022 431

Figure 62: Refining industry, North America, coking unit capacity market share vis-à-vis growth by country (%), 2017–2022 432

Figure 63: Refining industry, North America, catalytic cracker unit capacity market share vis-à-vis growth by country (%), 2017–2022 434

Figure 64: Refining industry, North America, hydrocracking unit capacity market share vis-à-vis growth by country (%), 2017–2022 435

Figure 65: Refining industry, North America, annual new build and expansion capital expenditure outlook for refineires ($M), 2023–2027 437

Figure 66: Refining industry, North America, annual new build and expansion capital expenditure outlook for refineries by country, ($M), 2023–2027 438

Figure 67: Refining industry, Oceania, refining capacity share vis-à-vis growth by Country (%), 2017–2022 489

Figure 68: Refining industry, Oceania, crude distillation unit capacity market share vis-à-vis growth by key countries (%), 2017–2022 490

Figure 69: Refining industry, Oceania, catalytic cracker unit capacity market share vis-à-vis growth by country (%), 2017–2022 492

Figure 70: Refining industry, Oceania, annual new build and expansion capital expenditure outlook for refineries ($M), 2023–2027 495

Figure 71: Refining industry, Oceania, annual new build and expansion capital expenditure outlook for refineries by country, ($M), 2023–2027 496

Figure 72: Refining industry, South America, refining capacity share vis-à-vis growth by key countries (%), 2017–2022 504

Figure 73: Refining industry, South America, crude distillation unit capacity market share vis-à-vis growth by key countries (%), 2017–2022 505

Figure 74: Refining industry, South America, coking unit capacity market share vis-à-vis growth by key countries (%), 2017–2022 506

Figure 75: Refining industry, South America, catalytic cracker unit capacity market share vis-à-vis growth by key countries (%), 2017–2022 507

Figure 76: Refining industry, South America, hydrocracking unit capacity market share vis-à-vis growth by country (%), 2017–2022 508

Figure 77: Refining industry, South America, annual new build and expansion capital expenditure outlook for refineries ($M), 2023–2027 510

Figure 78: Refining industry, South America, annual new build and expansion capital expenditure outlook for refineries by key countries, ($M), 2023–2027 511

Frequently asked questions

Refining Industry Capacity and Capital Expenditure Forecast by Region, Countries and All Operating and Planned Refineries to 2027 thematic reports
Currency USD
$5,000

Can be used by individual purchaser only

$15,000

Can be shared globally by unlimited users within the purchasing corporation e.g. all employees of a single company


Undecided about purchasing this report?

Enquire Before Buying Request a Free Sample

Get in touch to find out about multi-purchase discounts

reportstore@globaldata.com
Tel +44 20 7947 2745

Every customer’s requirement is unique. With over 220,000 construction projects tracked, we can create a tailored dataset for you based on the types of projects you are looking for. Please get in touch with your specific requirements and we can send you a quote.

Sample Report

Refining Industry Capacity and Capital Expenditure Forecast by Region, Countries and All Operating and Planned Refineries to 2027 was curated by the best experts in the industry and we are confident about its unique quality. However, we want you to make the most beneficial decision for your business, so we offer free sample pages to help you:

  • Assess the relevance of the report
  • Evaluate the quality of the report
  • Justify the cost

Download your copy of the sample report and make an informed decision about whether the full report will provide you with the insights and information you need.

Below is a sample report to understand what you are buying

See what our customers are saying

“The GlobalData platform is our go-to tool for intelligence services. GlobalData provides an easy way to access comprehensive intelligence data around multiple sectors, which essentially makes it a one-for-all intelligence platform, for tendering and approaching customers.

GlobalData is very customer orientated, with a high degree of personalised services, which benefits everyday use. The highly detailed project intelligence and forecast reports can be utilised across multiple departments and workflow scopes, from operational to strategic level, and often support strategic decisions. GlobalData Analytics and visualisation solutions has contributed positively when preparing management presentations and strategic papers.”

Business Intelligence & Marketing Manager, SAL Heavy Lift

“COVID-19 has caused significant interference to our business and the COVID-19 intelligence from GlobalData has helped us reach better decisions around strategy. These two highlights have helped enormously to understand the projections into the future concerning our business units, we also utilise the project database to source new projects for Liebherr-Werk to use as an additional source to pitch for new business.”

Market Analyst & Management, Liebherr-Werk

Your daily news has saved me a lot of time and keeps me up-to-date with what is happening in the market, I like that you almost always have a link to the source origin. We also use your market data in our Strategic Business Process to support our business decisions. By having everything in one place on the Intelligence Center it has saved me a lot of time versus looking on different sources, the alert function also helps with this.

Head of Key Accounts, Saab AB

Having used several other market research companies, I find that GlobalData manages to provide that ‘difficult-to-get’ market data that others can’t, as well as very diverse and complete consumer surveys.

Marketing Intelligence Manager, Portugal Foods

Our experience with GlobalData has been very good, from the platform itself to the people. I find that the analysts and the account team have a high level of customer focus and responsiveness and therefore I can always rely on. The platform is more holistic than other providers. It is convenient and almost like a one stop shop. The pricing suite is highly competitive and value for our organisation.

I like reports that inform new segments such as the analysis on generation Z, millennials, the impact of COVID 19 to our banking customers and their new channel habits. Secondly the specialist insight on affluent sector significantly increases our understanding about this group of customers. The combination of those give us depth and breadth of the evolving market.

I’m in the business of answering and helping people make decisions so with the intelligence center I can do that, effectively and efficiently. I can share quickly key insights that answer and satisfy our country stakeholders by giving them many quality studies and primary research about competitive landscape beyond the outlook of our bank. It helps me be seen as an advisory partner and that makes a big difference. A big benefit of our subscription is that no one holds the whole data and because it allows so many people, so many different parts of our organisation have access, it enables all teams to have the same level of knowledge and decision support.

Head of Customer Insight and Research, Standard Chartered

“I know that I can always rely on Globaldata’s work when I’m searching for the right consumer and market insights. I use Globaldata insights to understand the changing market & consumer landscape and help create better taste & wellbeing solutions for our customers in food, beverage and healthcare industries.

Globaldata has the right data and the reports are of very high quality compared to your competitors. Globaldata not only has overall market sizes & consumer insights on food & beverages but also provides insights at the ingredient & flavour level. That is key for B2B companies like Givaudan. This way we understand our customers’ business and also gain insight to our unique industry”

Head of Consumer Sensory Insights, Givaudan

GlobalData provides a great range of information and reports on various sectors that is highly relevant, timely, easy to access and utilise.  The reports and data dashboards help engagement with clients; they provide valuable industry and market insights that can enrich client conversations and can help in the shaping of value propositions. Moreover, using GlobalData products has helped increase my knowledge of the finance sector, the players within it, and the general threats and opportunities.

I find the consumer surveys that are carried out to be extremely beneficial and not something I have seen anywhere else. They provided an insightful view of why and which consumers take (or don’t) particular financial products. This can help shape conversations with clients to ensure they make the right strategic decisions for their business.

One of the challenges I have found is that data in the payments space is often piecemeal. With GD all of the data I need is in one place, but it also comes with additional market reports that provide useful extra context and information. Having the ability to set-up alerts on relevant movements in the industry, be it competitors or customers, and have them emailed directly to me, ensures I get early sight of industry activity and don’t have to search for news.

Senior Account Manager, TSYS
Go even deeper with GlobalData Intelligence Center

Every Company Report we produce is powered by the GlobalData Intelligence Center.

Subscribing to our intelligence platform means you can monitor developments at Refining Industry Capacity and Capital Expenditure Forecast by Region, Countries and All Operating and Planned Refineries to 2027 in real time.

  • Access a live Refining Industry Capacity and Capital Expenditure Forecast by Region, Countries and All Operating and Planned Refineries to 2027 dashboard for 12 months, with up-to-the-minute insights.
  • Fuel your decision making with real-time deal coverage and media activity.
  • Turn insights on financials, deals, products and pipelines into powerful agents of commercial advantage.