South Africa Defense Market Size and Trends, Budget Allocation, Regulations, Key Acquisitions, Competitive Landscape and Forecast, 2022-2027

Powered by

All the vital news, analysis, and commentary curated by our industry experts.

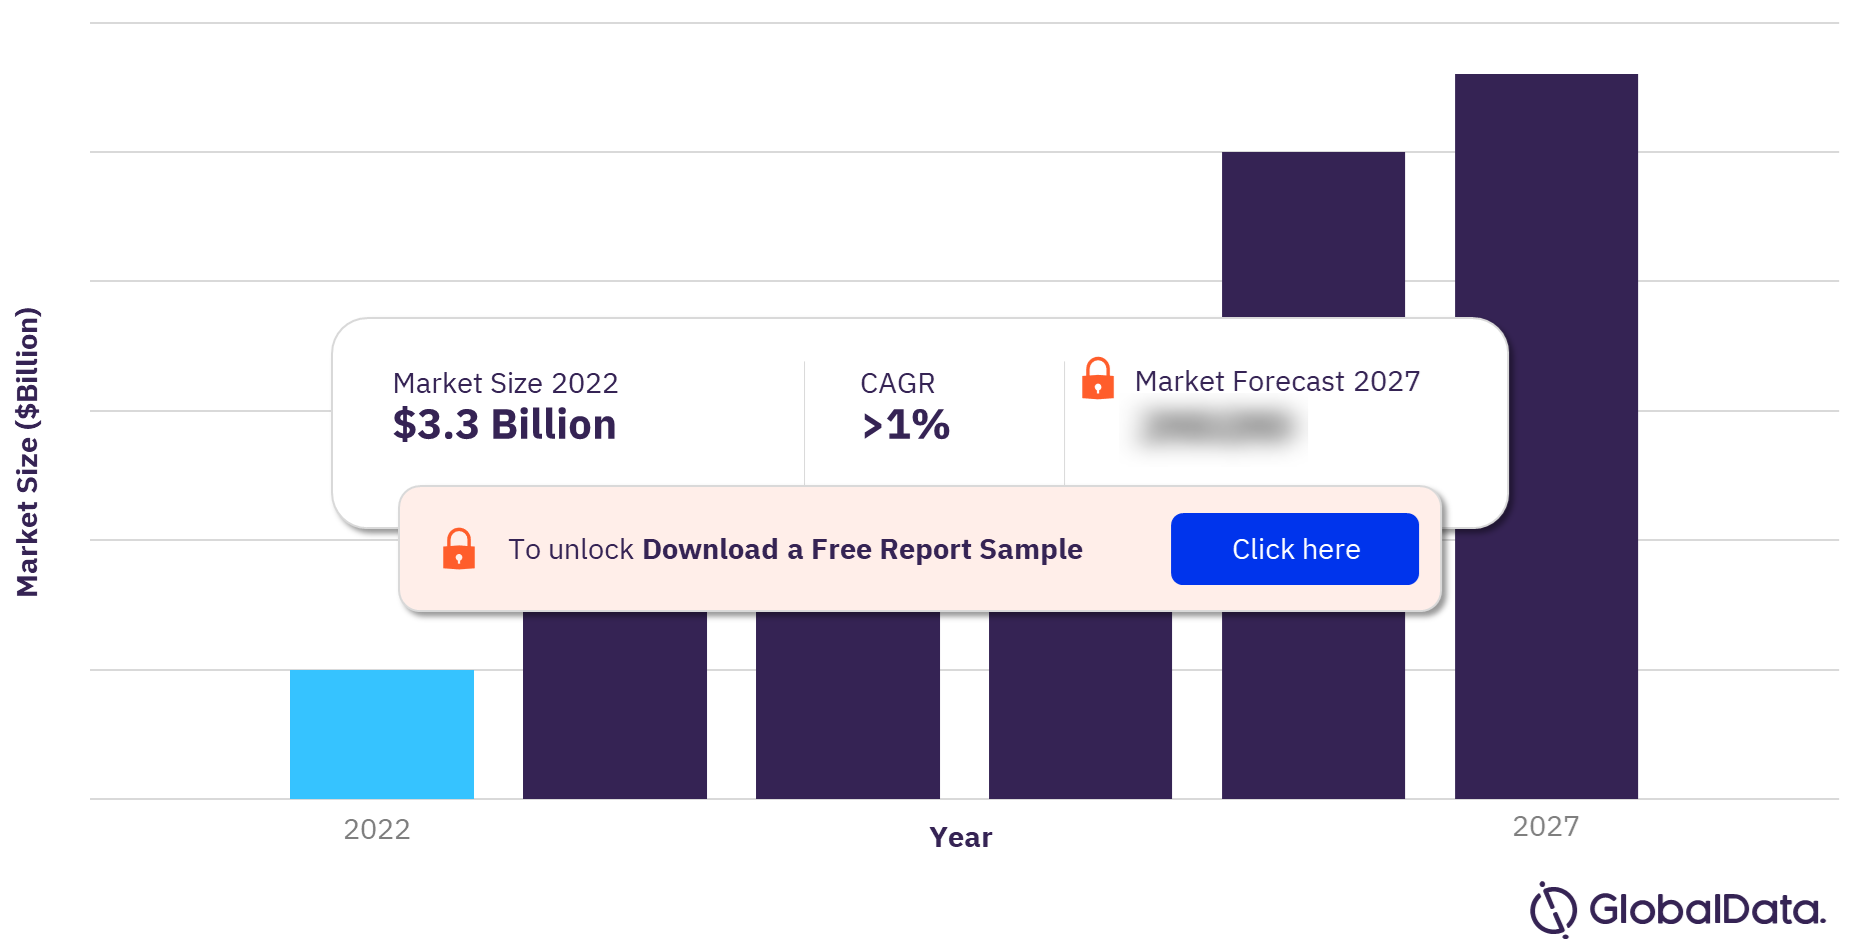
South Africa’s defense budget declined from 2018 to reach $3.3 billion in 2022. However, it is expected to achieve a CAGR of more than 1% during 2023-2027. The South Africa defense market research report provides the market size forecast and the projected growth rate for the next five years. The report covers industry analysis including the key market drivers, emerging technology trends, and major challenges faced by market participants. It also offers insights regarding key factors and government programs that are expected to influence the demand for military platforms over the forecast period.

South Africa Defense Market Overview

South Africa Defense Market Overview

To gain more information on the South Africa defense market forecast, download a free report sample

South Africa Defense Market Drivers

South Africa needs to raise its spending levels to maintain regional security, including operations in the Democratic Republic of the Congo (DRC) and Mozambique. Despite ongoing reforms, more than half of the defense spending is predicted to be allocated to personnel spending over the forecast period. Moreover, South Africa is attempting to boost domestic defense industrial capabilities and spending in the forecast period will be targeted to ensure this.

South Africa Military Doctrines and Defense Strategies

South Africa relies on its special forces for defense operations across domains, particularly for strategic reconnaissance, special tasks, and anti-terror operations. Medium-combat forces are utilized for projectable combat capabilities with higher levels of firepower and maneuvers. Additionally, heavy combat forces are self-supporting armor, artillery, and mechanized infantry brigades, which are utilized to boost the capabilities of other forces and adapt to strategic environments.

The South African 2015 defense review is the current document that governs military strategy in the country. Its domestic priorities include maintaining territorial integrity and order, as well as supporting governance and the economy. Its regional priorities include supporting other countries in Southern Africa, supporting trade, and attracting FDI.

South Africa Defense Market Segmentation by Sectors

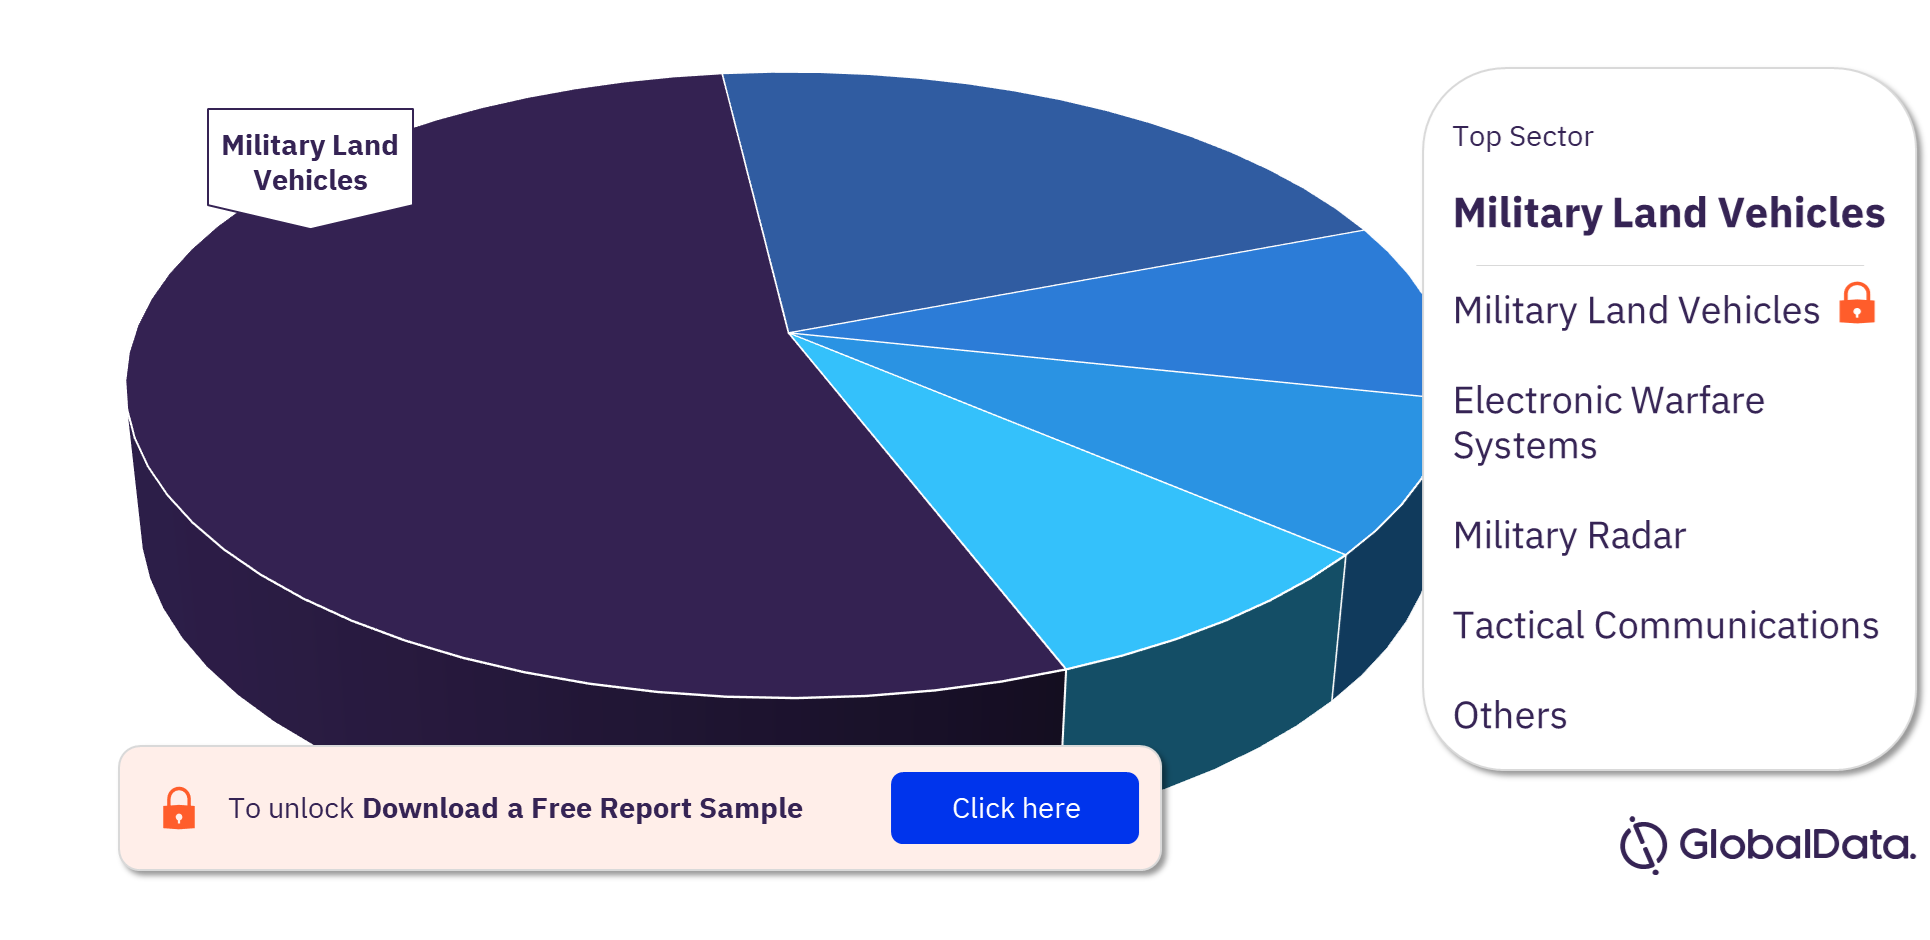
The top three sectors in the South Africa defense market are military land vehicles, electronic warfare systems, and military radar. Others include tactical communications, military fixed-wing, military ammunition, military simulation and training, naval vessels & surface combatants, military UAV, EOIR systems, underwater warfare systems, missiles and missile defense systems, INS GNSS, and body armor and personal protection. Military land vehicles is the largest sector in South Africa’s defense market, followed by electronic warfare and military radar.

South Africa Defense Market Analysis by Sectors

South Africa Defense Market Analysis by Sectors

For more sector insights into the South Africa defense market, download a free report sample

South Africa Defense Market Competitive Landscape

The leading defense companies in the South Africa defense market are Denel SOC Ltd, Reutech Pty Ltd, Ideco Group Limited, Square One Solutions Group Limited, ETION Ltd, Defensor Security (Pty) Ltd, Denel Aviation, Denel Land Systems, Hensoldt Optronics (Pty) Ltd, and Paramount Group.

South Africa Defense Market Report Overview

Market Size (2022) $3.3 billion
CAGR (2023-2027) >1%
Key Sectors Military Land Vehicles, Electronic Warfare Systems, Military Radar, Tactical Communications, Military Fixed-Wing, Military Ammunition, Military Simulation and Training, Naval Vessels & Surface Combatants, Military UAV, EOIR Systems, Underwater Warfare Systems, Missiles and Missile Defense Systems, INS GNSS, and Body Armor and Personal Protection
Leading Companies Denel SOC Ltd, Reutech Pty Ltd, Ideco Group Limited, Square One Solutions Group Limited, ETION Ltd, Defensor Security (Pty) Ltd, Denel Aviation, Denel Land Systems, Hensoldt Optronics (Pty) Ltd, and Paramount Group

Scope

This report provides:

  • Detailed analysis of the South Africa’s FY2022 defense budget broken down into market size and market share. This is coupled with an examination of key current and future acquisitions.
  • Explanation of the procurement policy and process. This is coupled with an analysis of South Africa’s military doctrine and strategy to provide a comprehensive overview of South Africa’s military regulation.
  • Examination of political alliances and perceived security threats to South Africa. They help to explain trends in spending and modernization.
  • Analysis of prevalent trends in the country’s imports and exports over the last five years.
  • Analysis of the competitive landscape of the South African defense industry.

Reasons to Buy

  • Determine prospective investment areas based on a detailed trend analysis of the South Africa defense market over the next five years.
  • Gain an in-depth understanding of the underlying factors driving demand for different defense and internal security segments in the South African market and identify the opportunities offered.
  • Strengthen your understanding of the market in terms of demand drivers, market trends, and the latest technological developments, among others.
  • Identify the major threats that are driving the South African defense market providing a clear picture of future opportunities that can be tapped, resulting in revenue expansion.
  • Channel resources by focusing on the ongoing programs that are being undertaken by the South African government.
  • Make correct business decisions based on an in-depth analysis of the competitive landscape consisting of detailed profiles of the top defense equipment providers in the country. The company profiles also include information about the key products, alliances, recent contracts awarded, and financial analysis, wherever available.

Paramount Group
Aerosud
Denel Dynamics
Saab
BAE Systems
Pilatus Aircraft
Dassault Aviation
Boeing
Cessena Aircraft Company
Lockheed Martin
Cessena Aircraft Company
Textron

Table of Contents

Table of Contents

Executive Summary

Defense Budget Assessment

Budgeting Process

Defense Market Size Historic And Forecast

Drivers Of Defense Expenditure

Analysis Of Defense Budget Allocation

Military Doctrine And Security Environment

Military Doctrine And Strategy

Political And Strategic Alliances

Market Entry Strategy And Regulations

Defense Procurement Bodies

Funding Opportunities

Trade Associations and Defense Clusters

Types of Contracts and Opportunities

Types of Procurement Procedure

Procurement Policy and Market Regulations

Market Entry Routes

Key Challenges

Major Deals and M&A

Market Attractiveness And Emerging Opportunities

Market Attractiveness, 2022-27

Top Defense Segments By Value

Import And Export Market Dynamics

Import Market Dynamics

Export Market Dynamics

Defense Platform Acquisitions

Defense Platform Acquisitions By Value

AHRLAC

Bataleur UAS

IFV

Fleet Size

Competitive Landscape

Defense Companies Operating In South Africa

Main Defense Companies

Appendix

About This Report

About Us

Contact Us

Table

List of Tables

Table 1: South Africa – Ongoing Development and Procurement Programs

Table 2: South Africa – Future Procurement Programs

Table 3: South Africa – Defense Procurement Programs by Value (US$ Million), 2019-2024

Table 4: South African Defense Expenditure (ZAR Billion and US$ Billion), 2015-2024

Table 5: South African GDP Growth vs Defense Expenditure as a Percentage of GDP, 2015-2024

Table 6: South African Defense Budget Split Between Capital and Revenue Expenditure (%), 2015-2024

Table 7: South African Defense Capital Expenditure (ZAR Billion & US$ Billion), 2015-2024

Table 8: South African Defense Budget Share (%) Split by Services (Army, Air Force, Navy and Other), 2015-2024

Table 9: South African Defense Budget Allocations in ZAR Billion – Breakdown by Services (Army, Air Force, Navy and Others), 2015-2024

Table 10: South African Defense Budget Allocations in US$ Billion – Breakdown by Services (Army, Air Force, Navy and Others), 2015-2024

Table 11: South African Per-Capita Defense Expenditure (US$), 2015-2024

Table 12: South African Homeland Security Expenditure (ZAR Billion & US$ Billion), 2015-2024

Table 13: Benchmarking with Key Markets – 2015-2019 vs 2020-2024

Table 14: South Africa – 10 Leading Defense Market Categories by Value (US$ Million), 2019-2024

Table 15: Methodology for Offset Credits

Table 16: Competitive Landscape of the South African Defense Industry

Table 17: South Africa – Top Defense Suppliers by Value (US$ Million), 2019-2024

Table 18: Denel – Products and Services

Table 19: Denel – Alliances

Table 20: Denel – Recent Contract Wins

Table 21: Ansys Limited – Products

Table 22: Ansys Limited – Alliances

Table 23: Ansys Limited – Recent Contract Wins

Table 24: Reutech – Products and Services

Table 25: Reutech – Alliances

Table 26: Reutech – Recent Contract Wins

Table 27: Saab Grintek – Products and Services

Table 28: Saab Grintek – Alliances

Table 29: Saab Grintek – Recent Contract Wins

Table 30: IVEMA – Products and Services

Table 31: IVEMA – Recent Contract Wins

Table 32: Aerosud – Products and Services

Table 33: Aerosud – Alliances

Table 34: Aerosud – Recent Contract Wins

Table 35: Global Armour – Products and Services

Table 36: Global Armour – Alliances

Table 37: Aerosud – Recent Contract Wins

Table 38: Milkor (Pty) – Products

Table 39: Milkor (Pty), Ltd. – Recent Contract Wins

Table 40: Paramount Advanced Technologies – Products

Table 41: Paramount Advanced Technologies – Recent Contract Wins

Table 42: Tellumat Defense – Products

Table 43: Tellumat Defense – Alliances

Table 44: Tellumat Defense – Recent Contract Wins

Figures

List of Figures

Figure 1: South African Defense Budget: 2020 and 2024

Figure 2: South African Defense Imports/Exports: 2014 and 2018

Figure 3: South Africa’s Top Prospective Procurements/Developments

Figure 4: South African National Security Threats

Figure 5: South Africa Partnering Countries for Defense Cooperation and Military Training

Figure 6: South African Defense Expenditure (ZAR Billion), 2015-2024

Figure 7: South African Defense Expenditure (US$ Billion), 2015-2024

Figure 8: South African GDP Growth vs Defense Expenditure as a Percentage of GDP, 2015-2024

Figure 9: South African Defense Budget Split Between Capital and Revenue Expenditure (%), 2015-2024

Figure 10: South African Defense Capital Expenditure (ZAR Billion), 2015-2024

Figure 11: South African Defense Capital Expenditure (US$ Billion), 2015-2024

Figure 12: South Africa – Defense Expenditure Allocation (%), 2015-2024

Figure 13: South African Defense Expenditure in ZAR Billion – Breakdown by Services (Army, Air Force, Navy and Others) 2015-2024

Figure 14: South African Defense Budget in US$ Billion – Breakdown by Services (Army, Air Force, Navy and Others), 2015-2024

Figure 15: South African Per-Capita Defense Expenditure (US$), 2015-2024

Figure 16: South African Homeland Security Budget (ZAR Billion), 2015-2024

Figure 17: South African Homeland Security Budget (US$ Billion), 2015-2024

Figure 18: Benchmarking with Key Markets – 2015-2019 vs 2020-2024

Figure 19: Defense Expenditure of the World’s Largest Military Spenders (US$ Billion), 2019 and 2024

Figure 20: Defense Expenditure as a Percentage of GDP of Largest Military Spenders (%), 2019

Figure 21: Airborne C4ISR Market Size (US$ Million), 2019-2024

Figure 22: Physical Security Market Size (US$ Million), 2019-2024

Figure 23: Infantry Fighting Vehicles: Market Size (US$ Million), 2019-2024

Figure 24: South Africa – Defense Procurements in Terms of Supplier Relationships, 2019

Figure 25: South African Defense Imports Trend (TIV Values), 2014-2018

Figure 26: South African Defense Imports by Country (%), 2014-2018

Figure 27: South African Defense Imports by Category (%), 2014-2018

Figure 28: South Africa Defense Exports Trend (TIV Values), 2014-2018

Figure 29: South African Defense Exports by Country (%), 2014-2018

Figure 30: South African’s Defense Exports by Category (%), 2014-2018

Figure 31: Industry Dynamics – Porter’s Five Forces Analysis

Figure 32: The South African Budgeting Process

Figure 33: Key Challenges in the South African Defense Market

Figure 34: South African Market Share Analysis, 2018

Figure 35: Ansys – Revenue Trend Analysis (2014-2018)

Figure 36: Ansys – Operating Income Trend Analysis (2014-2018)

Figure 37: Ansys – Net Income Trend Analysis (2014-2018)

Figure 38: South African GDP Per Capita (US$), 2015-2025

Figure 39: South African GDP Current Prices (US$ Billion), 2015-2025

Figure 40: South African LCU per US$ 2015-2024

Figure 41: South African Exports of Goods and Services (LCU Billion), 2005-2014

Figure 42: South African Imports of Goods and Services (LCU Billion), 2005-2014

Figure 43: South African Gross National Disposable Income (US$ Billion), 2005-2014

Figure 44: South African Good Exports (% of GDP), 2005-2014

Figure 45: South African Good Imports (% of GDP), 2005-2014

Figure 46: South African Goods Balance (% GDP), 2005-2012

Figure 47: South African Service Imports (% of GDP), 2005-2014

Figure 48: South African Service Exports (% of GDP), 2005-2014

Figure 49: South African Foreign Direct Investment, Net (BoP, Current US$ Billion), 2005-2014

Figure 50: South African Net Foreign Direct Investments (% of GDP), 2005-2014

Figure 51: South African Market Capitalization of Listed Companies (US$ Billion), 2005-2012

Figure 52: South African Market Capitalization of Listed Companies (% of GDP), 2005-2012

Figure 53: South African Mining, Manufacturing, and Utilities Output (US$ Billion), 2005-2014

Frequently asked questions

South Africa Defense Market Size and Trends, Budget Allocation, Regulations, Key Acquisitions, Competitive Landscape and Forecast, 2022-2027 standard reports
Currency USD
$1,250

Can be used by individual purchaser only

$2,500

Can be shared globally by unlimited users within the purchasing corporation e.g. all employees of a single company


Undecided about purchasing this report?

Enquire Before Buying Request a Free Sample

Get in touch to find out about multi-purchase discounts

reportstore@globaldata.com
Tel +44 20 7947 2745

Every customer’s requirement is unique. With over 220,000 construction projects tracked, we can create a tailored dataset for you based on the types of projects you are looking for. Please get in touch with your specific requirements and we can send you a quote.

Sample Report

South Africa Defense Market Size and Trends, Budget Allocation, Regulations, Key Acquisitions, Competitive Landscape and Forecast, 2022-2027 was curated by the best experts in the industry and we are confident about its unique quality. However, we want you to make the most beneficial decision for your business, so we offer free sample pages to help you:

  • Assess the relevance of the report
  • Evaluate the quality of the report
  • Justify the cost

Download your copy of the sample report and make an informed decision about whether the full report will provide you with the insights and information you need.

Below is a sample report to understand what you are buying

See what our customers are saying

“The GlobalData platform is our go-to tool for intelligence services. GlobalData provides an easy way to access comprehensive intelligence data around multiple sectors, which essentially makes it a one-for-all intelligence platform, for tendering and approaching customers.

GlobalData is very customer orientated, with a high degree of personalised services, which benefits everyday use. The highly detailed project intelligence and forecast reports can be utilised across multiple departments and workflow scopes, from operational to strategic level, and often support strategic decisions. GlobalData Analytics and visualisation solutions has contributed positively when preparing management presentations and strategic papers.”

Business Intelligence & Marketing Manager, SAL Heavy Lift

“COVID-19 has caused significant interference to our business and the COVID-19 intelligence from GlobalData has helped us reach better decisions around strategy. These two highlights have helped enormously to understand the projections into the future concerning our business units, we also utilise the project database to source new projects for Liebherr-Werk to use as an additional source to pitch for new business.”

Market Analyst & Management, Liebherr-Werk

Your daily news has saved me a lot of time and keeps me up-to-date with what is happening in the market, I like that you almost always have a link to the source origin. We also use your market data in our Strategic Business Process to support our business decisions. By having everything in one place on the Intelligence Center it has saved me a lot of time versus looking on different sources, the alert function also helps with this.

Head of Key Accounts, Saab AB

Having used several other market research companies, I find that GlobalData manages to provide that ‘difficult-to-get’ market data that others can’t, as well as very diverse and complete consumer surveys.

Marketing Intelligence Manager, Portugal Foods

Our experience with GlobalData has been very good, from the platform itself to the people. I find that the analysts and the account team have a high level of customer focus and responsiveness and therefore I can always rely on. The platform is more holistic than other providers. It is convenient and almost like a one stop shop. The pricing suite is highly competitive and value for our organisation.

I like reports that inform new segments such as the analysis on generation Z, millennials, the impact of COVID 19 to our banking customers and their new channel habits. Secondly the specialist insight on affluent sector significantly increases our understanding about this group of customers. The combination of those give us depth and breadth of the evolving market.

I’m in the business of answering and helping people make decisions so with the intelligence center I can do that, effectively and efficiently. I can share quickly key insights that answer and satisfy our country stakeholders by giving them many quality studies and primary research about competitive landscape beyond the outlook of our bank. It helps me be seen as an advisory partner and that makes a big difference. A big benefit of our subscription is that no one holds the whole data and because it allows so many people, so many different parts of our organisation have access, it enables all teams to have the same level of knowledge and decision support.

Head of Customer Insight and Research, Standard Chartered

“I know that I can always rely on Globaldata’s work when I’m searching for the right consumer and market insights. I use Globaldata insights to understand the changing market & consumer landscape and help create better taste & wellbeing solutions for our customers in food, beverage and healthcare industries.

Globaldata has the right data and the reports are of very high quality compared to your competitors. Globaldata not only has overall market sizes & consumer insights on food & beverages but also provides insights at the ingredient & flavour level. That is key for B2B companies like Givaudan. This way we understand our customers’ business and also gain insight to our unique industry”

Head of Consumer Sensory Insights, Givaudan

GlobalData provides a great range of information and reports on various sectors that is highly relevant, timely, easy to access and utilise.  The reports and data dashboards help engagement with clients; they provide valuable industry and market insights that can enrich client conversations and can help in the shaping of value propositions. Moreover, using GlobalData products has helped increase my knowledge of the finance sector, the players within it, and the general threats and opportunities.

I find the consumer surveys that are carried out to be extremely beneficial and not something I have seen anywhere else. They provided an insightful view of why and which consumers take (or don’t) particular financial products. This can help shape conversations with clients to ensure they make the right strategic decisions for their business.

One of the challenges I have found is that data in the payments space is often piecemeal. With GD all of the data I need is in one place, but it also comes with additional market reports that provide useful extra context and information. Having the ability to set-up alerts on relevant movements in the industry, be it competitors or customers, and have them emailed directly to me, ensures I get early sight of industry activity and don’t have to search for news.

Senior Account Manager, TSYS
Go even deeper with GlobalData Intelligence Center

Every Company Report we produce is powered by the GlobalData Intelligence Center.

Subscribing to our intelligence platform means you can monitor developments at South Africa Defense Market Size and Trends, Budget Allocation, Regulations, Key Acquisitions, Competitive Landscape and Forecast, 2022-2027 in real time.

  • Access a live South Africa Defense Market Size and Trends, Budget Allocation, Regulations, Key Acquisitions, Competitive Landscape and Forecast, 2022-2027 dashboard for 12 months, with up-to-the-minute insights.
  • Fuel your decision making with real-time deal coverage and media activity.
  • Turn insights on financials, deals, products and pipelines into powerful agents of commercial advantage.