Scoop Stack Shale in the United States of America (USA) – Oil and Gas Shale Market Analysis and Outlook to 2025
Powered by ![]()
All the vital news, analysis, and commentary curated by our industry experts.

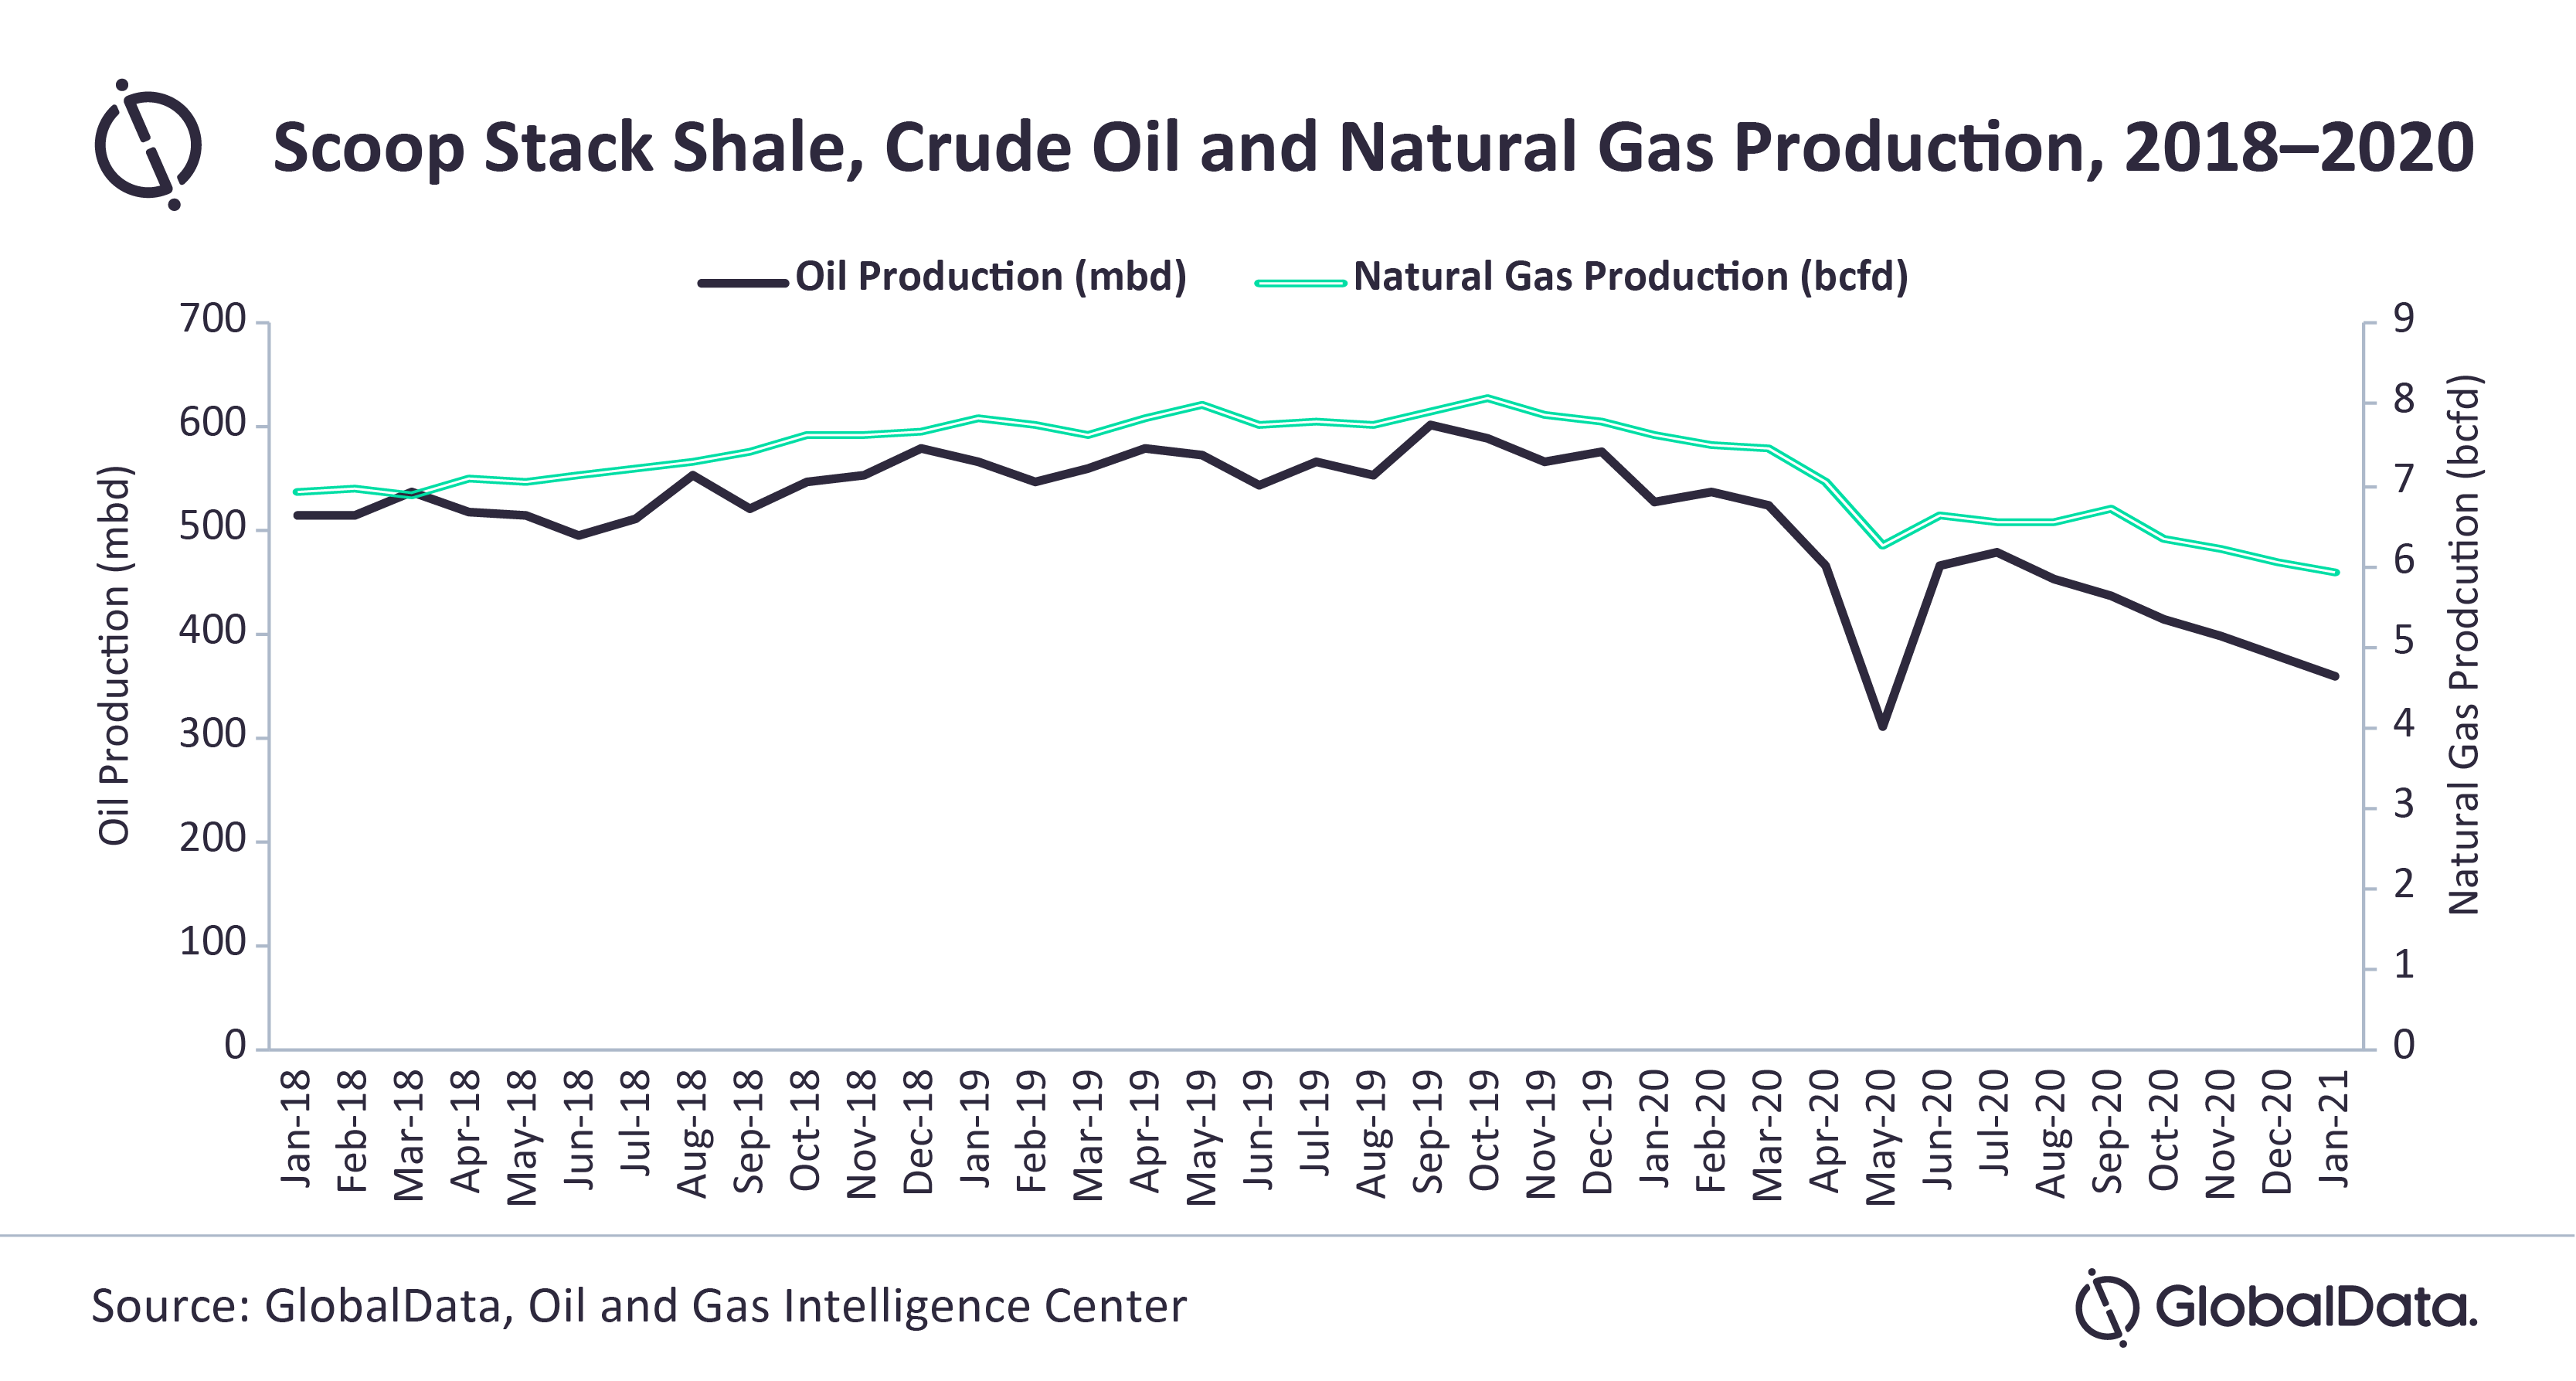
The Scoop Stack, located in Oklahoma, accounts for 4.5% of oil and 7.2% of natural gas production in the United States Lower 48. This play recorded its highest month of production in September 2019, with 604 thousand barrels of oil per day (mbd) and 7.9 billion cubic feet per day (bcfd). After September 2019, the Scoop Stack has experienced a slow decline that was exacerbated by the effects of the COVID-19 pandemic, says GlobalData, a leading data and analytics company.
GlobalData’s latest report, Scoop Stack Shale in the US, 2021, forecasts that in February 2021, production will be 342 mbd and 5.8 bcfd, which is a 43% decline in oil and 27% for natural gas from its peak in September 2019. This sharp decrease in production is linked to the drastic drop and rig count with companies reducing capital expenditure (capex), as well as focusing capex in other plays.
Andrew Folse, Oil & Gas Analyst at GlobalData, comments:
“The Scoop Stack averaged 84 drilling rigs in 2019 and decreased to an average of 20 drilling rigs in 2020 – which is a 75% drop. Since commodity prices have stabilized from the COVID-19 pandemic rig count has increased a small amount in the Scoop Stack. With West Texas Intermediate (WTI), future prices are averaging US$51.37 per bbl for the remainder of 2021. GlobalData expects an uptick in the rig count, but not to the level that was present in 2019.”
Scope
The report analyzes the crude oil and natural gas appraisal and production activities in Scoop Stack shale play in the US. The scope of the report includes:
Comprehensive analysis of natural gas and crude oil historical production and short term outlook of Scoop Stack shale play during 2021–2025
Detailed information of impact on well development, permits and deals due to COVID–19 pandemic
In-depth information on net acreage, operational performance and financial standings of major operators in Scoop Stack shale play
Analysis of future plans and cost trends of top companies
Up-to-date information on associated infrastructure and major mergers and acquisitions in Scoop Stack shale play between 2018 and 2020
Reasons to Buy
Develop business strategies with the help of specific insights into Scoop Stack shale play in the US
Plan your strategies based on economic viability and expected developments in Scoop Stack shale play
Keep yourself informed with the latest M&A activity in the shale play
Identify opportunities and challenges in Scoop Stack shale play
Table of Contents
Table
Figures
Frequently asked questions
Get in touch to find out about multi-purchase discounts
reportstore@globaldata.com
Tel +44 20 7947 2745
Every customer’s requirement is unique. With over 220,000 construction projects tracked, we can create a tailored dataset for you based on the types of projects you are looking for. Please get in touch with your specific requirements and we can send you a quote.
Sample Report
Scoop Stack Shale in the United States of America (USA) – Oil and Gas Shale Market Analysis and Outlook to 2025 was curated by the best experts in the industry and we are confident about its unique quality. However, we want you to make the most beneficial decision for your business, so we offer free sample pages to help you:
- Assess the relevance of the report
- Evaluate the quality of the report
- Justify the cost
Download your copy of the sample report and make an informed decision about whether the full report will provide you with the insights and information you need.


Related reports
View more Oil and Gas reports

