Counter-Drones Market Size, Trends and Analysis by Technology, Application, End-user, Platform, Region and Segment Forecast to 2026

Powered by

Access in-depth insight and stay ahead of the market

Counter Drones Market Overview

The counter drones market size by revenue will be valued at $1.53 billion in 2023 and is expected to grow at a compound annual growth rate (CAGR) of 19.3% over the forecast period. The adoption of counter-drones will be supported by the increasing use of drones for criminal activities and increasing adoption of drones in major countries.

Counter-drone technology, also known as counter-UAS, C-UAS, anti-drone, or counter-UAV technology, refers to systems that are used to detect and/or disable unmanned aircraft. As concerns mount around the potential security threats that drones may pose to civilian and military entities, a new market for counter-drone technology is rapidly emerging.

The market faces significant challenges from interdiction hazards and privacy concerns which are expected to impact growth over the forecast period. Some interdiction techniques might be dangerous if deployed in populated areas. Drones intercepted by kinetic means can crash with considerable force. Further, net-based systems equipped with a parachute involves a risk if the parachute fails to deploy correctly or if the interdiction occurs at a low altitude. Counter-drone systems are a form of surveillance technology and pose a risk to privacy if misused or if the data they collect is mismanaged.

Counter drones Market Outlook, 2021-26 ($ Billion)

Counter-drones Market Outlook, 2021-26 ($ Billion)

View Sample Report for Additional Insights on the Counter drones Market Forecast, Download a Free Report Sample 

Criminality (activities such as goods smuggling, hacking, and theft involving commercial/recreational drones is a major factor driving the development of C-UAS systems. Globally, there has been a 25% increase in drone related criminal activities between 2021 and 2022, paving the way for investments in counter-drones technologies by relevant authorities. Due to the relatively lower technological threshold for civil C-UAS systems, this sub-segment of the market is seeing much greater activity from SMEs and start-ups, while the military sub-segment continues to be dominated by prime companies such as Leonardo, Lockheed Martin, Raytheon Technologies, and others.

The civilian market represents a significant opportunity for producers given the ready availability of commercial UAVs and security breaches in major countries. As such, potential customers for C-UAS systems include, but are not limited to, the defense sector, national governments, private security, stadiums/amusement parks/public arenas, airports and transportation hubs, petroleum/chemical/electric grids, and nuclear and chemical installations, among other state and private security bodies.

Unmanned Aerial Vehicles/Systems (UAVs/UASs) have witnessed tremendous advances in terms of the number of deployed systems, as well as individual system capabilities, which in turn have led to the massive proliferation of UASs, leading to a steep demand curve that is only anticipated to rise over the next decade. Corresponding with this proliferation, as well as the employment of UAS in an increasing number of roles (Loyal Wingman, Unmanned Refueling, etc.) countries will be required to increase their investment in systems capable of countering drone threats.

Counter-drones Market Segmentation by Technology

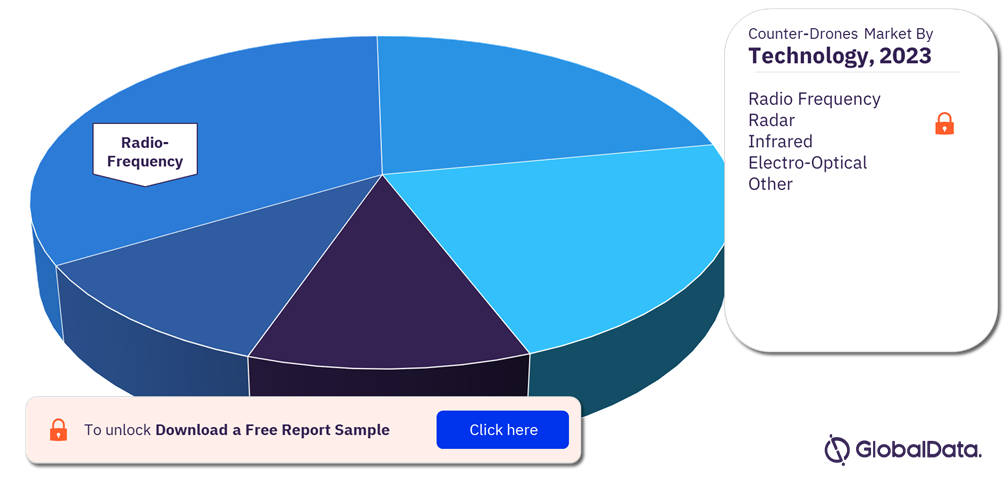
Counter-drones market by technology, includes radar, radio frequency, electro-optical, infrared, and others. Radar is one of the most used capabilities in C-UAS developers’ arsenals when developing new systems. Leaders in radar within C-UAS include Rafael, which produces I-Dome. Radio-frequency sensors detect, locate, and in some cases identify nearby drones by scanning for the frequencies on which most drones are known to operate. This sensor technology is commonly deployed in solutions targeted at resisting small drones, particularly in law enforcement roles.

Counter-drones Market Share by Technology, 2023 (%)

Counter-drones Market Share by Technology, 2023 (%)

Fetch Sample PDF for Technology Stream-Specific Revenues and Shares, Download a Free Report Sample

Counter-drones Market Segmentation by Application

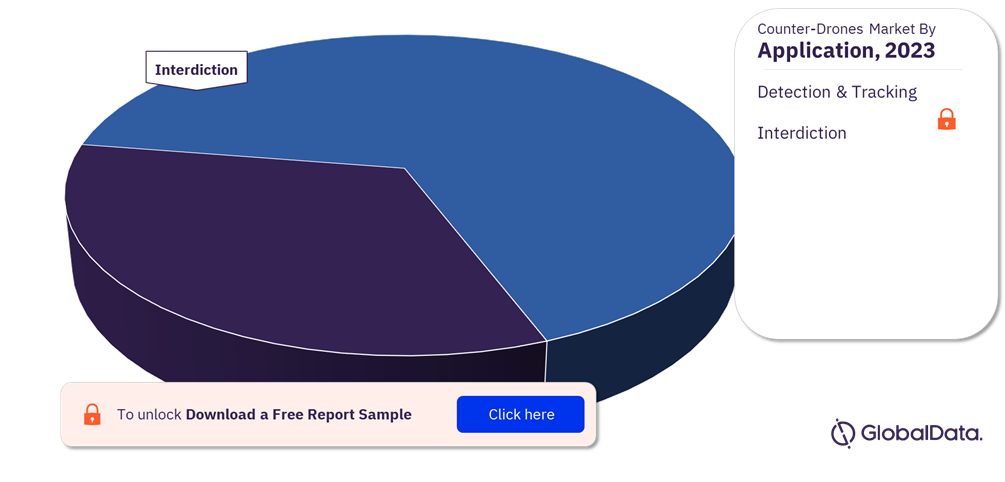
Counter-drones market by application includes detection & tracking, and interdiction. Detection & tracking broadly describes the capability to locate and track incoming UAS threats. The capability is a key prerequisite for a successful C-UAS capability, with being able to identify and locate an incoming threat as the first step in the counter-drone kill chain. Manufacturers are investing heavily in interdiction technologies such as laser and high-power microwaves.

By application, the interdiction segment accounted for the largest market share in 2022 and is expected to continue to dominate over the forecast period growing at a CAGR of more than 16% during the forecast period.

Counter-drones Market Share by Application, 2023 (%)

Counter-drones Market Share by Application, 2023 (%)

Fetch Sample PDF for Application-Specific Revenues and Shares, Download a Free Report Sample

Counter-drones Market Segmentation by End-user

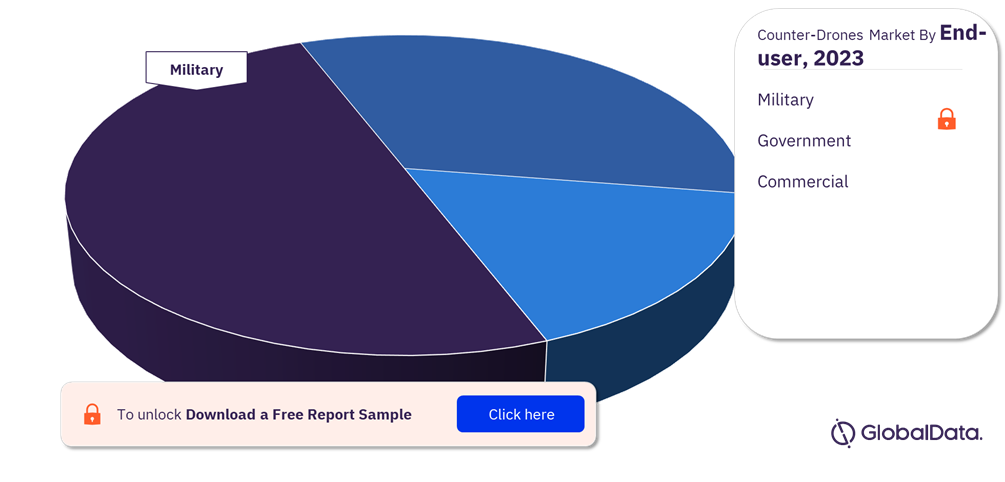
Counter-drones market by end-user includes military, government, and commercial. In FY2023, the Department of Defense (DOD) plans to spend at least $668 million on C-UAS research and development and at least $78 million on C-UAS procurement. In December 2019, the department’s various C-sUAS development programs were streamlined, with the Army acting as the executive agent overseeing all C-sUAS development efforts. On January 6, 2020, the Secretary of Defense approved the implementation plan of the new office, known as the Joint C-sUAS Office (JCO).

Criminality involving drones ranges from careless to intentional, from troublesome to malicious. Some forms of criminality are directed at an illicit profit, such as goods smuggling, hacking, and theft. These forms of actions generate demand for C-UAS systems in sensitive locations such as border areas and prisons. Other, graver forms of criminality include politically motivated attacks against VIPs and terrorist attacks against essential infrastructure.

By end-user, the military segment accounted for the largest market share in 2022 and is expected to continue to dominate over the forecast period growing at a CAGR of more than 17% during the forecast period.

Counter-drones Market Share by End-user,  2023 (%)

Counter-drones Market Share by End-user, 2023 (%)

Fetch Sample PDF for End-User-Specific Revenues and Shares, Download a Free Report Sample

Counter-drones Market Segmentation by Platform

Counter-drones market by platform includes ground-based, handheld, and UAV-based. Ground-based systems refer to systems designed to be used from either stationary position on the ground or mounted on vehicles and/or operated on the move. Different technologies for detection and interdiction can be used along with these ground-based systems. Handheld systems refer to systems designed to be operated by an individual by hand, most of these systems resemble a rifle. UAV-based systems are designed to be mounted on drones.

By platform, the ground-based segment accounted for the largest market share in 2022 and is expected to continue to dominate over the forecast period growing at a CAGR of more than 17% during the forecast period.

Counter-drones Market Share by Platform, 2023 (%)

Counter-drones Market Share by Platform, 2023 (%)

Fetch Sample PDF for Platform-Specific Revenues and Shares, Download a Free Report Sample

Counter-drones Market Analysis by Region

The North American drones market value was the highest in 2022, capturing over 30% of the overall market size. The regional demand was led by the US and China collectively accounting for over 40% of the counter-drones market in 2022. The rising use of commercial drones for criminal activities will drive the regional demand for counter-drone systems.

North America is projected to retain the largest share by 2026 accounting for over 30% of the global counter-drones market value, with a forecasted growth rate exceeding 17% from 2023 to 2026. The growing geopolitical unrest along the borders of Asian countries will favor the proliferation of the counter-drones market in Asia Pacific. Apart from the Asia Pacific market, the Middle East and Africa counter-drone market is also expected to witness growth over the near future, registering a CAGR of more than 13% from 2023 to 2026.

North America Counter-drones Market Share by Country, 2023 (%)

North America Counter-drones Market Share by Country, 2023 (%)

Fetch Sample PDF for Region-Specific Revenues and Shares, Download a Free Report Sample

Counter-drones Market - Competitive Landscape

Investments in R&D of new counter-drone technology are increasing, making the sector lucrative for both existing and new players in the market. Many local players are entering the market supplying various counter-drone solutions. Despite the presence of some larger dominant players such as CACI International Inc. and Raytheon Technologies Corp, smaller companies like Droneshield Ltd. and SKYLOCK have been able to successfully win military contracts.

The leading companies that specialize in counter-drones are Blighter Surveillance Systems Ltd., Dedrone Inc, D-Fend Solutions AD Ltd, Israel Aerospace Industries Ltd., Raytheon Technologies Corp., Leonardo SpA, Lockheed Martin Corp., Rafael Advanced Defense Systems Ltd, CACI International Inc, and Northrop Grumman Corp.

Counter-Drones Market Vendor Growth Innovation Matrix

Counter-Drones Market Vendor Growth Innovation Matrix

Leading Players in the Counter-drones Market

  • Blighter Surveillance Systems Ltd.
  • CACI International Inc.
  • Northrop Grumman
  • Leonardo SpA
  • Lockheed Martin Corporation
  • Israel Aerospace Industries
  • Raytheon Technologies Corporation
  • Rafael Advanced Defense Systems Ltd
  • D-Fend Solutions AD Ltd
  • Dedrone Inc

Other Counter-drones Market Vendors Mentioned

DroneShield Ltd, Liteye systems, Accipiter Radar, SKYLOCK, Boeing, Airbus Group SE, QinetiQ Group PLC, Thales Group, Advanced Radar Technologies S.A., and Aaronia AG

To Know More About Leading Counter-drones Market Players, Download a Free Report Sample

Counter-drones Market Research Scope

Market size in 2023 $1.53 billion
Market size in 2026 $2.52 billion
CAGR 19.3% from 2023 to 2026
Forecast period 2023-2026
Historic data 2021-2022
Report scope & coverage Revenue forecast, competitive index, company landscape, growth trends
Technology Radar, radio frequency, electro-optical, infrared, and others
Application Detection & tracking and interdiction
End-user Military, government, and commercial
Platform Ground-based, handheld, and UAV-based
Region Coverage North America, Europe, Asia Pacific, South & Central America, Middle East & Africa
Country Coverage US, Canada, UK, France, Germany, Russia, Italy, Netherlands, China, India, Japan, South Korea, Australia, UAE, Saudi Arabia, Israel, Qatar, Mexico, Brazil, Colombia
Key Companies Blighter Surveillance Systems Ltd., Dedrone Inc, D-Fend Solutions AD Ltd, Israel Aerospace Industries Ltd., Raytheon Technologies Corp., Leonardo SpA, Lockheed Martin Corp., Rafael Advanced Defense Systems Ltd, CACI International Inc, and Northrop Grumman Corp.

Counter-drones Market Segments and Scope

GlobalData Plc has segmented the global counter-drones market report by technology, application, end-user, platform, and region:

 Counter-drones Market Technology Outlook (Revenue, $Million, 2021-2026)

  • Radar
  • Radio frequency
  • Electro-optical
  • Infrared
  • Others

Counter-drones Market Application Outlook (Revenue, $Million, 2021-2026)

  • Detection & tracking
  • Interdiction

Counter-drones Market End-user Outlook (Revenue, $Million, 2021-2026)

  • Military
  • Government
  • Commercial

Counter-drones Market Platform Outlook (Revenue, $Million, 2021-2026)

  • Ground-based
  • Handheld
  • UAV-based

Counter-drones Market Regional Outlook (Revenue, $Million, 2021-2026)

  • North America
  • The US
  • Canada
  • Asia-pacific
  • China
  • Japan
  • South Korea
  • Australia
  • India
  • Rest of Asia Pacific
  • Europe
  • Germany
  • The UK
  • France
  • Italy
  • Russia
  • The Netherlands
  • Rest of Europe
  • South and Central America
  • Mexico
  • Brazil
  • Colombia
  • Rest of South and Central America
  • Middle East and Africa
  • Israel
  • The UAE
  • Saudi Arabia
  • Qatar
  • Rest of Middle East and Africa

The market intelligence report provides an in-depth analysis of the following –

  • Counter-drones market outlook: analysis as well as historical figures and forecasts of revenue opportunities from the technology, application, end-user, platform, and region segments.
  • The competitive landscape: an examination of the positioning of leading players in the counter-drones market.
  • Company snapshots: analysis of the market position of leading competitors in the counter-drones market.
  • Underlying assumptions behind our published base-case forecasts, as well as potential market developments that would alter, either positively or negatively, our base-case outlook.

Key Highlights

The global Counter drones market size reached USD 1.24 billion in 2022, according to a new report by GlobalData Plc. The adoption of counter drones will be supported by increasing use of commercial drones for criminal activities and increasing government spending on R&D and procurement of counter drone systems.

Reasons to Buy

  • This market intelligence report offers a thorough, forward-looking analysis of the global counter drones market by technology, application, end-user, platform, region, and key opportunities in a concise format to help executives build proactive and profitable growth strategies.
  • Accompanying GlobalData’s forecast products, the report examines the assumptions and drivers behind ongoing and upcoming trends in counter-drone markets.
  • With more than 140 charts and tables, the report is designed for an executive-level audience, with enhanced presentation quality.
  • The report provides an easily digestible market assessment for decision-makers built around in-depth information gathered from local market players, which enables executives to quickly get up to speed with the current and emerging trends in counter-drone markets.
  • The broad perspective of the report coupled with comprehensive, actionable detail, will help aerospace, defense & security stakeholders, service providers, and other counter-drone players succeed in growing the counter-drones market globally.

Key Players

Blighter Surveillance Systems Ltd
CACI International Inc
Northrop Grumman Corp
Leonardo SpA
Lockheed Martin Corp
Israel Aerospace Industries Ltd
RTX Corp
Rafael Advanced Defense Systems Ltd
D-Fend Solutions AD Ltd
Dedrone Inc

Table of Contents

  • CHAPTER 01 Executive Summary
  • CHAPTER 02 Research scope & Segmentation

    • 2.1 Market Definitions

  • CHAPTER 03 Market Overview & Industry Analysis

    • 3.1 Market Overview
    • 3.2 Industry Value Chain Analysis

      • 3.2.1 Detection & Tracking
      • 3.2.2 Interdiction: Conventional Projectiles
      • 3.2.3 Interdiction: Unconventional Projectiles
      • 3.2.4 Interdiction: Directed Energy
      • 3.2.5 Interdiction: Jamming
      • 3.2.6 Interdiction: Combined Interdiction

    • 3.3 Market Drivers
    • 3.4 Market Restraints
    • 3.5 Technological Trends
    • 3.6 Regulatory Trends
    • 3.7 Macroeconomic Trends
    • 3.8 Russia-Ukraine – Market Impact Analysis

  • CHAPTER 04 Global Counter Drones Market Revenue Opportunity

    • 4.1 Global Market Revenue Snapshot
    • 4.2 Global Counter Drone Market By Technology, 2021-2026($ Mn)
    • 4.3 Global Counter Drone Market By Application, 2021-2026($ Mn)
    • 4.4 Global Counter Drone Market By End-user, 2021-2026($ Mn)
    • 4.5 Global Counter Drone Market By Platform, 2021-2026($ Mn)

  • CHAPTER 05 Revenue Opportunity & Forecasts By Region

    • 5.1 Counter Drones – Regional Overview & Analysis
    • 5.2 North America Counter Drones Market – Overview

      • 5.2.1 North America Counter Drones Market by Technology 2021-2026 ($M)
      • 5.2.2 North America Counter Drones Market by Application 2021-2026 ($M)
      • 5.2.3 North America Counter Drones Market by End-user 2021-2026 ($M)
      • 5.2.4 North America Counter Drones Market by Platform 2021-2026 ($M)

        • 5.2.4.1 US Counter Drones Market by Technology 2021-2026 ($M)
        • 5.2.4.2 US Counter Drones Market by Application 2021-2026 ($M)
        • 5.2.4.3 US Counter Drones Market by End-user 2021-2026 ($M)
        • 5.2.4.4 US Counter Drones Market by Platform 2021-2026 ($M)
        • 5.2.4.5 Canada Counter Drones Market by Technology 2021-2026 ($M)
        • 5.2.4.6 Canada Counter Drones Market by Application 2021-2026 ($M)
        • 5.2.4.7 Canada Counter Drones Market by End-user 2021-2026 ($M)
        • 5.2.4.8 Canada Counter Drones Market by Platform 2021-2026 ($M)

    • 5.3 Europe Counter Drones Market, 2021-2026 ($M)

      • 5.3.1 Europe Counter Drones Market by Technology 2021-2026 ($M)
      • 5.3.2 Europe Counter Drones Market by Application 2021-2026 ($M)
      • 5.3.3 Europe Counter Drones Market by End-user 2021-2026 ($M)
      • 5.3.4 Europe Counter Drones Market by Platform 2021-2026 ($M)

        • 5.3.4.1 UK Counter Drones Market by Technology 2021-2026 ($M)
        • 5.3.4.2 UK Counter Drones Market by Application 2021-2026 ($M)
        • 5.3.4.3 UK Counter Drones Market by End-user 2021-2026 ($M)
        • 5.3.4.4 UK Counter Drones Market by Platform 2021-2026 ($M)
        • 5.3.4.5 France Counter Drones Market by Technology 2021-2026 ($M)
        • 5.3.4.6 France Counter Drones Market by Application 2021-2026 ($M)
        • 5.3.4.7 France Counter Drones Market by End-user 2021-2026 ($M)
        • 5.3.4.8 France Counter Drones Market by Platform 2021-2026 ($M)
        • 5.3.4.9 Germany Counter Drones Market by Technology 2021-2026 ($M)
        • 5.3.4.10 Germany Counter Drones Market by Application 2021-2026 ($M)
        • 5.3.4.11 Germany Counter Drones Market by End-user 2021-2026 ($M)
        • 5.3.4.12 Germany Counter Drones Market by Platform 2021-2026 ($M)
        • 5.3.4.13 Russia Counter Drones Market by Technology 2021-2026 ($M)
        • 5.3.4.14 Russia Counter Drones Market by Application 2021-2026 ($M)
        • 5.3.4.15 Russia Counter Drones Market by End-user 2021-2026 ($M)
        • 5.3.4.16 Russia Counter Drones Market by Platform 2021-2026 ($M)
        • 5.3.4.17 Italy Counter Drones Market by Technology 2021-2026 ($M)
        • 5.3.4.18 Italy Counter Drones Market by Application 2021-2026 ($M)
        • 5.3.4.19 Italy Counter Drones Market by End-user 2021-2026 ($M)
        • 5.3.4.20 Italy Counter Drones Market by Platform 2021-2026 ($M)
        • 5.3.4.21 Netherlands Counter Drones Market by Technology 2021-2026 ($M)
        • 5.3.4.22 Netherlands Counter Drones Market by Application 2021-2026 ($M)
        • 5.3.4.23 Netherlands Counter Drones Market by End-user 2021-2026 ($M)
        • 5.3.4.24 Netherlands Counter Drones Market by Platform 2021-2026 ($M)
        • 5.3.4.25 Rest of Europe Counter Drones Market by Technology 2021-2026 ($M)
        • 5.3.4.26 Rest of Europe Counter Drones Market by Application 2021-2026 ($M)
        • 5.3.4.27 Rest of Europe Counter Drones Market by End-user 2021-2026 ($M)
        • 5.3.4.28 Rest of Europe Counter Drones Market by Platform 2021-2026 ($M)

    • 5.4 Asia Pacific Counter Drones Market, 2021-2026 ($M)

      • 5.4.1 Asia Pacific Counter Drones Market by Technology 2021-2026 ($M)
      • 5.4.2 Asia Pacific Counter Drones Market by Application 2021-2026 ($M)
      • 5.4.3 Asia Pacific Counter Drones Market by End-user 2021-2026 ($M)
      • 5.4.4 Asia Pacific Counter Drones Market by Platform 2021-2026 ($M)

        • 5.4.4.1 China Counter Drones Market by Technology 2021-2026 ($M)
        • 5.4.4.2 China Counter Drones Market by Application 2021-2026 ($M)
        • 5.4.4.3 China Counter Drones Market by End-user 2021-2026 ($M)
        • 5.4.4.4 China Counter Drones Market by Platform 2021-2026 ($M)
        • 5.4.4.5 India Counter Drones Market by Technology 2021-2026 ($M)
        • 5.4.4.6 India Counter Drones Market by Application 2021-2026 ($M)
        • 5.4.4.7 India Counter Drones Market by End-user 2021-2026 ($M)
        • 5.4.4.8 India Counter Drones Market by Platform 2021-2026 ($M)
        • 5.4.4.9 Japan Counter Drones Market by Technology 2021-2026 ($M)
        • 5.4.4.10 Japan Counter Drones Market by Application 2021-2026 ($M)
        • 5.4.4.11 Japan Counter Drones Market by End-user 2021-2026 ($M)
        • 5.4.4.12 Japan Counter Drones Market by Platform 2021-2026 ($M)
        • 5.4.4.13 South Korea Counter Drones Market by Technology 2021-2026 ($M)
        • 5.4.4.14 South Korea Counter Drones Market by Application 2021-2026 ($M)
        • 5.4.4.15 South Korea Counter Drones Market by End-user 2021-2026 ($M)
        • 5.4.4.16 South Korea Counter Drones Market by Platform 2021-2026 ($M)
        • 5.4.4.17 Australia Counter Drones Market by Technology 2021-2026 ($M)
        • 5.4.4.18 Australia Counter Drones Market by Application 2021-2026 ($M)
        • 5.4.4.19 Australia Counter Drones Market by End-user 2021-2026 ($M)
        • 5.4.4.20 Australia Counter Drones Market by Platform 2021-2026 ($M)
        • 5.4.4.21 Rest of Asia Pacific Counter Drones Market by Technology 2021-2026 ($M)
        • 5.4.4.22 Rest of Asia Pacific Counter Drones Market by Application 2021-2026 ($M)
        • 5.4.4.23 Rest of Asia Pacific Counter Drones Market by End-user 2021-2026 ($M)
        • 5.4.4.24 Rest of Asia Pacific Counter Drones Market by Platform 2021-2026 ($M)

    • 5.5 Middle East & Africa Counter Drones Market, 2021-2026 ($M)

      • 5.5.1 Middle East & Africa Counter Drones Market by Technology 2021-2026 ($M)
      • 5.5.2 Middle East & Africa Counter Drones Market by Application 2021-2026 ($M)
      • 5.5.3 Middle East & Africa Counter Drones Market by End-user 2021-2026 ($M)
      • 5.5.4 Middle East & Africa Counter Drones Market by Platform 2021-2026 ($M)

        • 5.5.4.1 Saudi Arabia Counter Drones Market by Technology 2021-2026 ($M)
        • 5.5.4.2 Saudi Arabia Counter Drones Market by Application 2021-2026 ($M)
        • 5.5.4.3 Saudi Arabia Counter Drones Market by End-user 2021-2026 ($M)
        • 5.5.4.4 Saudi Arabia Counter Drones Market by Platform 2021-2026 ($M)
        • 5.5.4.5 Israel Counter Drones Market by Technology 2021-2026 ($M)
        • 5.5.4.6 Israel Counter Drones Market by Application 2021-2026 ($M)
        • 5.5.4.7 Israel Counter Drones Market by End-user 2021-2026 ($M)
        • 5.5.4.8 Israel Counter Drones Market by Platform 2021-2026 ($M)
        • 5.5.4.9 UAE Counter Drones Market by Technology 2021-2026 ($M)
        • 5.5.4.10 UAE Counter Drones Market by Application 2021-2026 ($M)
        • 5.5.4.11 UAE Counter Drones Market by End-user 2021-2026 ($M)
        • 5.5.4.12 UAE Counter Drones Market by Platform 2021-2026 ($M)
        • 5.5.4.13 Qatar Counter Drones Market by Technology 2021-2026 ($M)
        • 5.5.4.14 Qatar Counter Drones Market by Application 2021-2026 ($M)
        • 5.5.4.15 Qatar Counter Drones Market by End-user 2021-2026 ($M)
        • 5.5.4.16 Qatar Counter Drones Market by Platform 2021-2026 ($M)
        • 5.5.4.17 Rest of Middle East & Africa Counter Drones Market by Technology 2021-2026 ($M)
        • 5.5.4.18 Rest of Middle East & Africa Counter Drones Market by Application 2021-2026 ($M)
        • 5.5.4.19 Rest of Middle East & Africa Counter Drones Market by End-user 2021-2026 ($M)
        • 5.5.4.20 Rest of Middle East & Africa Counter Drones Market by Platform 2021-2026 ($M)

    • 5.6 South & Central America Counter Drones Market, 2021-2026 ($M)

      • 5.6.1 South & Central America Counter Drones Market by Technology 2021-2026 ($M)
      • 5.6.2 South & Central America Counter Drones Market by Application 2021-2026 ($M)
      • 5.6.3 South & Central America Counter Drones Market by End-user 2021-2026 ($M)
      • 5.6.4 South & Central America Counter Drones Market by Platform 2021-2026 ($M)

        • 5.6.4.1 Brazil Counter Drones Market by Technology 2021-2026 ($M)
        • 5.6.4.2 Brazil Counter Drones Market by Application 2021-2026 ($M)
        • 5.6.4.3 Brazil Counter Drones Market by End-user 2021-2026 ($M)
        • 5.6.4.4 Brazil Counter Drones Market by Platform 2021-2026 ($M)
        • 5.6.4.5 Colombia Counter Drones Market by Technology 2021-2026 ($M)
        • 5.6.4.6 Colombia Counter Drones Market by Application 2021-2026 ($M)
        • 5.6.4.7 Colombia Counter Drones Market by End-user 2021-2026 ($M)
        • 5.6.4.8 Colombia Counter Drones Market by Platform 2021-2026 ($M)
        • 5.6.4.9 Mexico Counter Drones Market by Technology 2021-2026 ($M)
        • 5.6.4.10 Mexico Counter Drones Market by Application 2021-2026 ($M)
        • 5.6.4.11 Mexico Counter Drones Market by End-user 2021-2026 ($M)
        • 5.6.4.12 Mexico Counter Drones Market by Platform 2021-2026 ($M)
        • 5.6.4.13 Rest of South & Central America Counter Drones Market by Technology 2021-2026 ($M)
        • 5.6.4.14 Rest of South & Central America Counter Drones Market by Application 2021-2026 ($M)
        • 5.6.4.15 Rest of South & Central America Counter Drones Market by End-user 2021-2026 ($M)
        • 5.6.4.16 Rest of South & Central America Counter Drones Market by Platform 2021-2026 ($M)

  • CHAPTER 06 Global Counter Drones Competitive Landscape

    • 6.1 Counter Drones Competitive Index
    • 6.1 Counter Drones Vendor Competitive Landscape
    • 6.2 Top M&A Deals in Counter Drones Market
    • 6.3 Patent Activity Analysis
    • 6.4 Company Profile: Blighter Surveillance Systems Ltd.
    • 6.5 Company Profile: Dedrone Inc
    • 6.6 Company Profile: D-Fend Solutions AD Ltd
    • 6.7 Company Profile: Israel Aerospace Industries Ltd.
    • 6.8 Company Profile: Raytheon Technologies Corp.
    • 6.9 Company Profile: Leonardo SpA
    • 6.10 Company Profile: Lockheed Martin Corp.
    • 6.11 Company Profile: Rafael Advanced Defense Systems Ltd
    • 6.12 Company Profile: CACI International Inc
    • 6.13 Company Profile: Northrop Grumman Corp
    • 6.14 Counter-drones – Prominent Companies In The Counter-drones Market

  • CHAPTER 07 Case Studies – Regional Use Cases
  • CHAPTER 08 Research Methodology

    • 8.1 Research Methodology Steps

      • 8.1.1 Market Study
      • 8.1.2 Research
      • 8.1.3 Analysis
      • 8.1.4 Quality Control

Table

List of Tables

Table 1 Market Definitions

Table 2 Limitations of Detection & Tracking techniques

Table 3 Counter-drones Vendor Competitive Landscape

Table 4 Counter-drones –Mergers and Acquisitions

Table 5 Counter-drones – Prominent Companies In The Counter-drone Market

Table 6 Thematic Screen for Defense Companies

Figures

List of Figures

Fig 1. Counter Drones Market – Segmentation

Fig 2. Counter Drones Market– Value Chain Analysis

Fig 3. Counter Drones Value Chain: Detection & Tracking Leaders & Disruptors

Fig 4. Counter Drones Value Chain: Conventional Projectiles Leaders & Disruptors

Fig 5. Counter Drones Value Chain: Unconventional Projectiles Leaders & Disruptors

Fig 6. Counter Drones Value Chain: Directed Energy Leaders & Disruptors

Fig 7. Counter Drones Value Chain: Jamming Leaders & Disruptors

Fig 8. Counter Drones Value Chain: Combined Interdiction Leaders & Disruptors

Fig 9.Global Counter Drones Market By Technology, 2021 – 2026 ($Mn)

Fig 10.Global Counter Drones Market By Application, 2021 – 2026 ($Mn)

Fig 11.Global Counter Drones Market By End user, 2021 – 2026 ($Mn)

Fig 12.Global Counter Drones Market By Platform, 2021 – 2026 ($Mn)

Fig 13.North America Counter Drones Market By Technology, 2021 – 2026 ($Mn)

Fig 14.North America Counter Drones Market By Application, 2021 – 2026 ($Mn)

Fig 15.North America Counter Drones Market By End user, 2021 – 2026 ($Mn)

Fig 16.North America Counter Drones Market By Platform, 2021 – 2026 ($Mn)

Fig 17. US Counter Drones Market By Technology, 2021 – 2026 ($Mn)

Fig 18. US Counter Drones Market By Application, 2021 – 2026 ($Mn)

Fig 19. US Counter Drones Market By End user, 2021 – 2026 ($Mn)

Fig 20. US Counter Drones Market By Platform, 2021 – 2026 ($Mn)

Fig 21. Canada Counter Drones Market By Technology, 2021 – 2026 ($Mn)

Fig 22. Canada Counter Drones Market By Application, 2021 – 2026 ($Mn)

Fig 23. Canada Counter Drones Market By End user, 2021 – 2026 ($Mn)

Fig 24. Canada Counter Drones Market By Platform, 2021 – 2026 ($Mn)

Fig 25. Europe Counter Drones Market By Technology, 2021 – 2026 ($Mn)

Fig 26. Europe Counter Drones Market By Application, 2021 – 2026 ($Mn)

Fig 27. Europe Counter Drones Market By End user, 2021 – 2026 ($Mn)

Fig 28. Europe Counter Drones Market By Platform, 2021 – 2026 ($Mn)

Fig 29. UK Counter Drones Market By Technology, 2021 – 2026 ($Mn)

Fig 30. UK Counter Drones Market By Application, 2021 – 2026 ($Mn)

Fig 31. UK Counter Drones Market By End user, 2021 – 2026 ($Mn)

Fig 32. UK Counter Drones Market By Platform, 2021 – 2026 ($Mn)

Fig 33. France Counter Drones Market By Technology, 2021 – 2026 ($Mn)

Fig 34. France Counter Drones Market By Application, 2021 – 2026 ($Mn)

Fig 35. France Counter Drones Market By End user, 2021 – 2026 ($Mn)

Fig 36. France Counter Drones Market By Platform, 2021 – 2026 ($Mn)

Fig 37. Germany Counter Drones Market By Technology, 2021 – 2026 ($Mn)

Fig 38. Germany Counter Drones Market By Application, 2021 – 2026 ($Mn)

Fig 39. Germany Counter Drones Market By End user, 2021 – 2026 ($Mn)

Fig 40. Germany Counter Drones Market By Platform, 2021 – 2026 ($Mn)

Fig 41. Russia Counter Drones Market By Technology, 2021 – 2026 ($Mn)

Fig 42. Russia Counter Drones Market By Application, 2021 – 2026 ($Mn)

Fig 43. Russia Counter Drones Market By End user, 2021 – 2026 ($Mn)

Fig 44. Russia Counter Drones Market By Platform, 2021 – 2026 ($Mn)

Fig 45. Italy Counter Drones Market By Technology, 2021 – 2026 ($Mn)

Fig 46. Italy Counter Drones Market By Application, 2021 – 2026 ($Mn)

Fig 47. Italy Counter Drones Market By End user, 2021 – 2026 ($Mn)

Fig 48. Italy Counter Drones Market By Platform, 2021 – 2026 ($Mn)

Fig 49. Netherlands Counter Drones Market By Technology, 2021 – 2026 ($Mn)

Fig 50. Netherlands Counter Drones Market By Application, 2021 – 2026 ($Mn)

Fig 51. Netherlands Counter Drones Market By End user, 2021 – 2026 ($Mn)

Fig 52. Netherlands Counter Drones Market By Platform, 2021 – 2026 ($Mn)

Fig 53. Rest of Europe Counter Drones Market By Technology, 2021 – 2026 ($Mn)

Fig 54. Rest of Europe Counter Drones Market By Application, 2021 – 2026 ($Mn)

Fig 55. Rest of Europe Counter Drones Market By End user, 2021 – 2026 ($Mn)

Fig 56. Rest of Europe Counter Drones Market By Platform, 2021 – 2026 ($Mn)

Fig 57. Asia Pacific Counter Drones Market By Technology, 2021 – 2026 ($Mn)

Fig 58. Asia Pacific Counter Drones Market By Application, 2021 – 2026 ($Mn)

Fig 59. Asia Pacific Counter Drones Market By End user, 2021 – 2026 ($Mn)

Fig 60. Asia Pacific Counter Drones Market By Platform, 2021 – 2026 ($Mn)

Fig 61. China Counter Drones Market By Technology, 2021 – 2026 ($Mn)

Fig 62. China Counter Drones Market By Application, 2021 – 2026 ($Mn)

Fig 63. China Counter Drones Market By End user, 2021 – 2026 ($Mn)

Fig 64. China Counter Drones Market By Platform, 2021 – 2026 ($Mn)

Fig 65. India Counter Drones Market By Technology, 2021 – 2026 ($Mn)

Fig 66. India Counter Drones Market By Application, 2021 – 2026 ($Mn)

Fig 67. India Counter Drones Market By End user, 2021 – 2026 ($Mn)

Fig 68. India Counter Drones Market By Platform, 2021 – 2026 ($Mn)

Fig 69. Japan Counter Drones Market By Technology, 2021 – 2026 ($Mn)

Fig 70. Japan Counter Drones Market By Application, 2021 – 2026 ($Mn)

Fig 71. Japan Counter Drones Market By End user, 2021 – 2026 ($Mn)

Fig 72. Japan Counter Drones Market By Platform, 2021 – 2026 ($Mn)

Fig 73. South Korea Counter Drones Market By Technology, 2021 – 2026 ($Mn)

Fig 74. South Korea Counter Drones Market By Application, 2021 – 2026 ($Mn)

Fig 75. South Korea Counter Drones Market By End user, 2021 – 2026 ($Mn)

Fig 76. South Korea Counter Drones Market By Platform, 2021 – 2026 ($Mn)

Fig 77. Australia Counter Drones Market By Technology, 2021 – 2026 ($Mn)

Fig 78. Australia Counter Drones Market By Application, 2021 – 2026 ($Mn)

Fig 79. Australia Counter Drones Market By End user, 2021 – 2026 ($Mn)

Fig 80. Australia Counter Drones Market By Platform, 2021 – 2026 ($Mn)

Fig 81. Rest of Asia Pacific Counter Drones Market By Technology, 2021 – 2026 ($Mn)

Fig 82. Rest of Asia Pacific Counter Drones Market By Application, 2021 – 2026 ($Mn)

Fig 83. Rest of Asia Pacific Counter Drones Market By End user, 2021 – 2026 ($Mn)

Fig 84. Rest of Asia Pacific Counter Drones Market By Platform, 2021 – 2026 ($Mn)

Fig 85. Middle East & Africa Counter Drones Market By Technology, 2021 – 2026 ($Mn)

Fig 86. Middle East & Africa Counter Drones Market By Application, 2021 – 2026 ($Mn)

Fig 87. Middle East & Africa Counter Drones Market By End user, 2021 – 2026 ($Mn)

Fig 88. Middle East & Africa Counter Drones Market By Platform, 2021 – 2026 ($Mn)

Fig 89. Saudi Arabia Counter Drones Market By Technology, 2021 – 2026 ($Mn)

Fig 90. Saudi Arabia Counter Drones Market By Application, 2021 – 2026 ($Mn)

Fig 91. Saudi Arabia Counter Drones Market By End user, 2021 – 2026 ($Mn)

Fig 92. Saudi Arabia Counter Drones Market By Platform, 2021 – 2026 ($Mn)

Fig 93. Israel Counter Drones Market By Technology, 2021 – 2026 ($Mn)

Fig 94. Israel Counter Drones Market By Application, 2021 – 2026 ($Mn)

Fig 95. Israel Counter Drones Market By End user, 2021 – 2026 ($Mn)

Fig 96. Israel Counter Drones Market By Platform, 2021 – 2026 ($Mn)

Fig 97. UAE Counter Drones Market By Technology, 2021 – 2026 ($Mn)

Fig 98. UAE Counter Drones Market By Application, 2021 – 2026 ($Mn)

Fig 99. UAE Counter Drones Market By End user, 2021 – 2026 ($Mn)

Fig 100. UAE Counter Drones Market By Platform, 2021 – 2026 ($Mn)

Fig 101. Qatar Counter Drones Market By Technology, 2021 – 2026 ($Mn)

Fig 102. Qatar Counter Drones Market By Application, 2021 – 2026 ($Mn)

Fig 103. Qatar Counter Drones Market By End user, 2021 – 2026 ($Mn)

Fig 104. Qatar Counter Drones Market By Platform, 2021 – 2026 ($Mn)

Fig 105. Rest of Middle East & Africa Counter Drones Market By Technology, 2021 – 2026 ($Mn)

Fig 106. Rest of Middle East & Africa Counter Drones Market By Application, 2021 – 2026 ($Mn)

Fig 107.Rest of Middle East & Africa Counter Drones Market By End user, 2021 – 2026 ($Mn)

Fig 108.Rest of Middle East & Africa Counter Drones Market By Platform, 2021 – 2026 ($Mn)

Fig 109.South & Central America Counter Drones Market By Technology, 2021 – 2026 ($Mn)

Fig 110.South & Central America Counter Drones Market By Application, 2021 – 2026 ($Mn)

Fig 111.South & Central America Counter Drones Market By End user, 2021 – 2026 ($Mn)

Fig 112.South & Central America Counter Drones Market By Platform, 2021 – 2026 ($Mn)

Fig 113.Brazil Counter Drones Market By Technology, 2021 – 2026 ($Mn)

Fig 114.Brazil Counter Drones Market By Application, 2021 – 2026 ($Mn)

Fig 115.Brazil Counter Drones Market By End user, 2021 – 2026 ($Mn)

Fig 116.Brazil Counter Drones Market By Platform, 2021 – 2026 ($Mn)

Fig 117.Colombia Counter Drones Market By Technology, 2021 – 2026 ($Mn)

Fig 118.Colombia Counter Drones Market By Application, 2021 – 2026 ($Mn)

Fig 119.Colombia Counter Drones Market By End user, 2021 – 2026 ($Mn)

Fig 120.Colombia Counter Drones Market By Platform, 2021 – 2026 ($Mn)

Fig 121.Mexico Counter Drones Market By Technology, 2021 – 2026 ($Mn)

Fig 122.Mexico Counter Drones Market By Application, 2021 – 2026 ($Mn)

Fig 123.Mexico Counter Drones Market By End user, 2021 – 2026 ($Mn)

Fig 124.Mexico Counter Drones Market By Platform, 2021 – 2026 ($Mn)

Fig 125.Rest of South & Central America Counter Drones Market By Technology, 2021 – 2026 ($Mn)

Fig 126.Rest of South & Central America Counter Drones Market By Application, 2021 – 2026 ($Mn)

Fig 127.Rest of South & Central America Counter Drones Market By End user, 2021 – 2026 ($Mn)

Fig 128.Rest of South & Central America Counter Drones Market By Platform, 2021 – 2026 ($Mn)

Fig 129. Counter Drones – Vendor Growth-Innovation Matrix

Fig 130. Global Filing/Grant Trends in counter drones

Fig 131. Counter drone Patents : Global Trending Sectors by Total Publications

Fig 132. Geographical Distribution : Counter drone Patents across all Sectors (%), 2019-2022

Fig 133. Top Patent Assignee for Counter Drones by Total Publications, 2019-2022

Fig 134. Core Objectives of the Market Study

Fig 135. Research Approach

Fig 136. Analysis Flow

Fig 137 Quality Control Flow

Frequently asked questions

  • What will be the counter-drones size in 2023?

    The counter-drones market size globally will be valued at $1.53 billion in 2023.

  • What is the counter-drones market growth rate?

    The counter-drones market is expected to grow at a CAGR of 19.3% during the forecast period (2023-2026).

  • What are the key counter-drones market drivers?

    Increasing use of commercial drones for criminal activities and increasing adoption of drones in major countries are stimulating the growth of the counter-drones market worldwide.

  • What are the key counter-drones market segments?

    Technology: Radar, Radio Frequency, Electro-optical, Infrared, and Others

    Application: Detection & Tracking, and Interdiction

    End-user: Military, Government, and Commercial

    Platform: Ground-based, Handheld, and UAV-based

    Regions: North America, Europe, Asia Pacific, South and Central America, Middle East and Africa.

  • Which are the leading counter-drone companies?

    The leading counter-drone companies globally are Blighter Surveillance Systems Ltd., Dedrone Inc, D-Fend Solutions AD Ltd, Israel Aerospace Industries Ltd., Raytheon Technologies Corp., Leonardo SpA, Lockheed Martin Corp., Rafael Advanced Defense Systems Ltd, CACI International Inc, and Northrop Grumman Corp.

  • Is there a third level of segmentation in the report?

    GlobalData’s focus is on providing reliable and accurate data that is supported by robust research methodology. Our reports undergo rigorous quality checks and are based on primary and secondary research sources, ensuring that the numbers and insights provided are trustworthy.  However, despite the best efforts to gather comprehensive data, there could be instances where the available data is limited, making it challenging to provide third level segmentation. In such cases, GlobalData may choose to provide high-level insights and general trends rather than forcing segmentation that may not be backed by sufficient data. This approach ensures that the report’s overall quality and credibility are maintained.

Currency USD
$3,950

Can be used by individual purchaser only

$7,950

Can be shared globally by unlimited users within the purchasing corporation e.g. all employees of a single company


Undecided about purchasing this report?

Enquire Before Buying Request a Free Sample

Get in touch to find out about multi-purchase discounts

reportstore@globaldata.com
Tel +44 20 7947 2745

Every customer’s requirement is unique. With over 220,000 construction projects tracked, we can create a tailored dataset for you based on the types of projects you are looking for. Please get in touch with your specific requirements and we can send you a quote.

Sample Report

We are confident about Counter-Drones Market Size, Trends and Analysis by Technology, Application, End-user, Platform, Region and Segment Forecast to 2026 report's unique quality. However, we want you to make the most beneficial decision for your business, so we offer free sample pages to help you:

  • Assess the relevance of the report
  • Evaluate the quality of the report
  • Justify the cost

Download your copy of the sample report and make an informed decision about whether the full report will provide you with the insights and information you need.

Below is a sample report to understand what you are buying

See what our customers are saying

“The GlobalData platform is our go-to tool for intelligence services. GlobalData provides an easy way to access comprehensive intelligence data around multiple sectors, which essentially makes it a one-for-all intelligence platform, for tendering and approaching customers.

GlobalData is very customer orientated, with a high degree of personalised services, which benefits everyday use. The highly detailed project intelligence and forecast reports can be utilised across multiple departments and workflow scopes, from operational to strategic level, and often support strategic decisions. GlobalData Analytics and visualisation solutions has contributed positively when preparing management presentations and strategic papers.”

Business Intelligence & Marketing Manager, SAL Heavy Lift

“COVID-19 has caused significant interference to our business and the COVID-19 intelligence from GlobalData has helped us reach better decisions around strategy. These two highlights have helped enormously to understand the projections into the future concerning our business units, we also utilise the project database to source new projects for Liebherr-Werk to use as an additional source to pitch for new business.”

Market Analyst & Management, Liebherr-Werk

Your daily news has saved me a lot of time and keeps me up-to-date with what is happening in the market, I like that you almost always have a link to the source origin. We also use your market data in our Strategic Business Process to support our business decisions. By having everything in one place on the Intelligence Center it has saved me a lot of time versus looking on different sources, the alert function also helps with this.

Head of Key Accounts, Saab AB

Having used several other market research companies, I find that GlobalData manages to provide that ‘difficult-to-get’ market data that others can’t, as well as very diverse and complete consumer surveys.

Marketing Intelligence Manager, Portugal Foods

Our experience with GlobalData has been very good, from the platform itself to the people. I find that the analysts and the account team have a high level of customer focus and responsiveness and therefore I can always rely on. The platform is more holistic than other providers. It is convenient and almost like a one stop shop. The pricing suite is highly competitive and value for our organisation.

I like reports that inform new segments such as the analysis on generation Z, millennials, the impact of COVID 19 to our banking customers and their new channel habits. Secondly the specialist insight on affluent sector significantly increases our understanding about this group of customers. The combination of those give us depth and breadth of the evolving market.

I’m in the business of answering and helping people make decisions so with the intelligence center I can do that, effectively and efficiently. I can share quickly key insights that answer and satisfy our country stakeholders by giving them many quality studies and primary research about competitive landscape beyond the outlook of our bank. It helps me be seen as an advisory partner and that makes a big difference. A big benefit of our subscription is that no one holds the whole data and because it allows so many people, so many different parts of our organisation have access, it enables all teams to have the same level of knowledge and decision support.

Head of Customer Insight and Research, Standard Chartered

“I know that I can always rely on Globaldata’s work when I’m searching for the right consumer and market insights. I use Globaldata insights to understand the changing market & consumer landscape and help create better taste & wellbeing solutions for our customers in food, beverage and healthcare industries.

Globaldata has the right data and the reports are of very high quality compared to your competitors. Globaldata not only has overall market sizes & consumer insights on food & beverages but also provides insights at the ingredient & flavour level. That is key for B2B companies like Givaudan. This way we understand our customers’ business and also gain insight to our unique industry”

Head of Consumer Sensory Insights, Givaudan

GlobalData provides a great range of information and reports on various sectors that is highly relevant, timely, easy to access and utilise.  The reports and data dashboards help engagement with clients; they provide valuable industry and market insights that can enrich client conversations and can help in the shaping of value propositions. Moreover, using GlobalData products has helped increase my knowledge of the finance sector, the players within it, and the general threats and opportunities.

I find the consumer surveys that are carried out to be extremely beneficial and not something I have seen anywhere else. They provided an insightful view of why and which consumers take (or don’t) particular financial products. This can help shape conversations with clients to ensure they make the right strategic decisions for their business.

One of the challenges I have found is that data in the payments space is often piecemeal. With GD all of the data I need is in one place, but it also comes with additional market reports that provide useful extra context and information. Having the ability to set-up alerts on relevant movements in the industry, be it competitors or customers, and have them emailed directly to me, ensures I get early sight of industry activity and don’t have to search for news.

Senior Account Manager, TSYS
Go even deeper with GlobalData Intelligence Center

Every Company Report we produce is powered by the GlobalData Intelligence Center.

Subscribing to our intelligence platform means you can monitor developments at Counter-Drones Market Size, Trends and Analysis by Technology, Application, End-user, Platform, Region and Segment Forecast to 2026 in real time.

  • Access a live Counter-Drones Market Size, Trends and Analysis by Technology, Application, End-user, Platform, Region and Segment Forecast to 2026 dashboard for 12 months, with up-to-the-minute insights.
  • Fuel your decision making with real-time deal coverage and media activity.
  • Turn insights on financials, deals, products and pipelines into powerful agents of commercial advantage.