Country Profile: Seasonings, Dressings & Sauces sector in Greece

Powered by

All the vital news, analysis, and commentary curated by our industry experts.

GlobalData’s "Country Profile: Seasonings, Dressings & Sauces sector in Greece", provides insights on high growth markets to target, trends in the usage of packaging materials, types and closures category level distribution data and brands market shares.

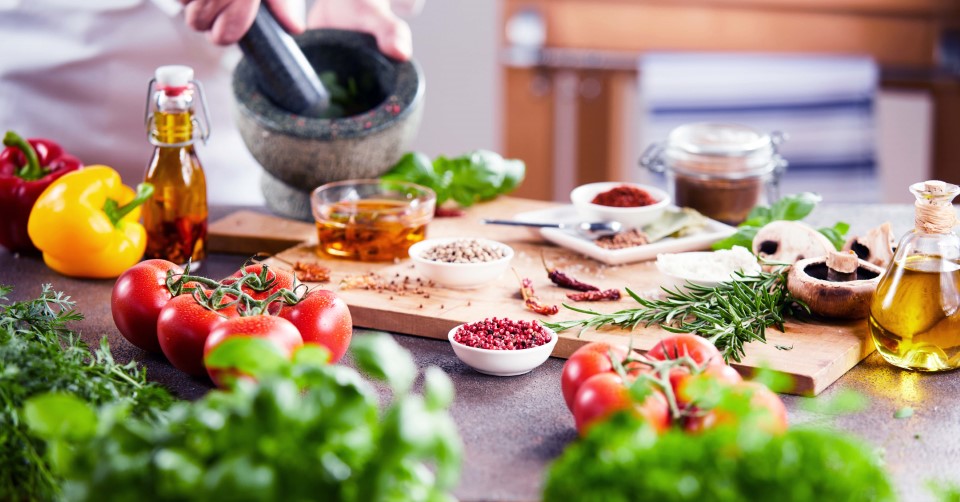
Gradual economic recovery post bailout and rising urbanisation rates are forecast to drive the demand for Seasonings, Dressings & Sauces sector in Greece. Tomato Pastes and Purées is the largest market in both value and volume terms in 2016, while Dips market is expected to register the fastest value growth during 2016-2021. Hypermarkets & Supermarkets is the leading distribution channel for Seasonings, Dressings & Sauces in the country, while Glass is the most commonly used packaging material. Unilever Plc, KYKNOS SA, Melissa Kikizas S.A., and Barilla G. & R. Fratelli are the leading players in the Sauces sector.

What else is contained?
– Market data: Overall market value and volume data with growth analysis for 2011-2021
– Category coverage: Value and growth analysis for Bouillons & Stocks, Chutneys & Relishes, Condiment Sauces, Dips, Dressings, Dry Cooking Sauces, Herbs, Spices & Seasonings, Tomato Pastes and Purées, and, Wet Cooking Sauces with inputs on individual category share within each market and the change in their market share forecast for 2016-2021
– Leading players: Market share of brands and private labels, including private label growth analysis from 2011-2016
– Distribution data: Percentage of sales within each market through distribution channels such as Cash & Carries and warehouse Clubs, Hypermarkets & Supermarkets, Convenience Stores, Food & Drinks Specialists, eRetailers and others
– Packaging data: consumption breakdown for packaging materials and containers in each market, in terms of percentage share of number of units sold. Packaging material data for Glass, Flexible Packaging, Paper & Board, Rigid Plastics, and others; container data for: Jar, Bottle, Bag/Sachet, Tub, Box, Pouch, and Tube.

Scope

– The Seasonings, Dressings & Sauces sector in Greece is forecast to grow at 2.8% CAGR in value terms during 2016-2021

– Chutneys & Relishes and Dips, with a high growth rate and low market share, provides significant opportunity to manufacturers

– Hypermarkets & Supermarkets is the largest distribution channel, followed by Convenience Stores and, Food & Drinks Specialists

– Pummaro is the leading brand in the Greek Seasonings, Dressings & Sauces sector in both value and volume terms

– Glass is the most commonly used packaging material in the Greek Seasonings, Dressings & Sauces sector

Reasons to Buy

– Identify high potential categories and explore further market opportunities based on detailed value and volume analysis

– Existing and new players can analyze key distribution channels to identify and evaluate trends and opportunities

– Gain an understanding of the total competitive landscape based on detailed brand share analysis to plan effective market positioning

– Manufacturers can identify the opportunities to position products with H&W attributes/benefits

– Access the key and most influential consumer trends driving Prepared Meals products consumption, and how they influence consumer behavior in the market which will help determine the best audiences to target

– Our team of analysts have placed a significant emphasis on changes expected in the market that will provide a clear picture of the opportunities that can be tapped over the next five years, resulting in revenue expansion

– The packaging analysis report helps manufacturers, in identifying the most commonly used packaging materials in the sector

– Analysis on key macro-economic indicators such as GDP per capita, population (overall and breakdown by age), and consumer price index. It also covers a comparative analysis of political, economic, socio-demographic, and technological indicators (PEST) across 50 countries.

Nestle S.A.
Unilever Plc
ATLANTA SA
Dimfil
Gaea Products S.A.
Kalas Group
Lelia
RoyalCo/Tsatsoulis Bros S.A.
Trofino
Xenia
H. J. Heinz Company
Mediterranean Foods SA
The French`s Food Company LLC
The Kraft Heinz Company
Ab World Foods Ltd
McIlhenny Company
Thai Fish Sauce Factory Co. Ltd
EKMA
Lee Kum Kee
Kikkoman Corporation
KYKNOS SA
Silver Swan Manufacturing Co
Bruce Foods Corporation
El Sabor
PepsiCo Inc.
Kraft Foods Group Inc.
Premier Foods Group Limited
ANATOLI SPICES S.A.
Mccormick & Company Inc.
Yiotis SA
HPA
PERLA
REA
Melissa Kikizas S.A.
Omospondia
Zanae
Mars Incorporated
Barilla G. & R. Fratelli
Rascal

Table of Contents

Table of Contents

1. Report Scope 9

2. Executive summary 10

3. Greece in the global and regional context 11

3.1. Greece’s market share in the Global and Western Europe Seasonings, Dressings & Sauces sectors 11

3.2. Greece compared to other leadingcountries in the Western Europe region 12

4. Market size analysis – Seasonings, Dressings & Sauces Sector 13

4.1. Value and volume analysis – Seasonings, Dressings & Sauces sector in Greece 13

4.2. Per capita consumption analysis -Greece compared to the global and Western Europe region 14

4.3. Value and volume analysisof markets in the Seasonings, Dressings & Saucessector 15

4.4. Growth analysis by markets 16

5. Market and category analysis 17

5.1. Per capita consumption analysis by markets 17

5.2. Market analysis: Bouillons & Stocks 18

5.3. Market analysis: Chutneys & Relishes 20

5.4. Market analysis: Condiment Sauces 22

5.5. Market analysis: Dips 25

5.6. Market analysis: Dressings 27

5.7. Market analysis: Dry Cooking Sauces 30

5.8. Market analysis: Herbs, Spices & Seasonings 32

5.9. Market analysis: Tomato Pastes and Purées 35

5.10. Market analysis: Wet Cooking Sauces 36

6. Distribution analysis 39

6.1. Distribution channel share analysis: Seasonings, Dressings & Sauces 39

6.2. Distribution channel share analysis: Bouillons & Stocks 40

6.3. Distribution channel share analysis: Chutneys & Relishes 41

6.4. Distribution channel share analysis: Condiment Sauces 42

6.5. Distribution channel share analysis: Dips 43

6.6. Distribution channel share analysis:Dressings 44

6.7. Distribution channel share analysis: Dry Cooking Sauces 45

6.8. Distribution channel share analysis: Herbs, Spices & Seasonings 46

6.9. Distribution channel share analysis: Tomato Pastes and Purées 47

6.10. Distribution channel share analysis: Wet Cooking Sauces 48

7. Competitive landscape 49

7.1. Brand share analysis by sector 49

7.2. Brand share analysis by markets 52

7.3. Brand share analysis by category 62

7.3.1. Bouillons & Stocks 62

7.3.2. Chutneys & Relishes 63

7.3.3. Condiment Sauces 64

7.3.4. Dips 67

7.3.5. Dressings 68

7.3.6. Dry Cooking Sauces 69

7.3.7. Herbs, Spices & Seasonings 70

7.3.8. Wet Cooking Sauces 73

8. Packaging analysis 75

8.1. Packaging share and growth analysis by packaging material in the Seasonings, Dressings & Sauces sector 75

8.2. Packaging share analysis by packaging materialin Seasonings, Dressings & Sauces markets 76

8.3. Packaging share and growth analysis by container type in the Seasonings, Dressings & Sauces sector 77

8.4. Packaging share analysis by container type in Seasonings, Dressings & Sauces markets 78

8.5. Packaging share and growth analysis by closure type in the Seasonings, Dressings & Sauces sector 79

8.6. Packaging share analysis by closure type in Seasonings, Dressings & Sauces markets 80

8.7. Packaging share and growth analysis by outer type in the Seasonings, Dressings & Sauces sector 81

8.8. Packaging share analysis by outer type in Seasonings, Dressings & Sauces markets 82

9. Macroeconomic analysis 83

9.1. GDP per Capita 86

9.2. Population and population growth 87

9.3. Consumer Price Index 88

9.4. Population breakdown by age 89

10. Methodology 90

11. Definitions 91

12. Appendix 97

13. About GlobalData 119

14. Disclaimer 120

15. Contact Us 121

Table

List of Tables

Table 1: Volume share of Greece in the global and Western Europe Seasonings, Dressings & Sauces sector, 2011-2021 11

Table 2: Growth analysis by markets, 2016-2021 16

Table 3: Value analysis of Bouillons & Stocks market by categories, 2011-2021 19

Table 4: Volume analysis of Bouillons & Stocks market by categories, 2011-2021 19

Table 5: Value analysis of Chutney & Relishes market by categories, 2011-2021 21

Table 6: Volume analysis of Chutney & Relishes market by categories, 2011-2021 21

Table 7: Value analysis of Condiment Sauces market by categories, 2011-2021 23

Table 8: Volume analysis of Condiment Sauces marketby categories, 2011-2021 24

Table 9: Value analysis of Dips market by categories, 2011-2021 26

Table 10: Volume analysis of Dips marketby categories, 2011-2021 26

Table 11: Value analysis of Dressings marketby categories, 2011-2021 28

Table 12: Volume analysis of Dressings market by categories, 2011-2021 29

Table 13: Value analysis of Dry Cooking Sauces market by categories, 2011-2021 31

Table 14: Volume analysis of Dry Cooking Sauces market by categories, 2011-2021 31

Table 15: Value analysis of Herbs, Spices & Seasonings market by categories, 2011-2021 33

Table 16: Volume analysis of Herbs, Spices & Seasonings marketby categories, 2011-2021 34

Table 17: Value analysis of Wet Cooking Sauces marketby categories, 2011-2021 37

Table 18: Volume analysis of Wet Cooking Sauces market by categories, 2011-2021 38

Table 19: Brand Value and Volume-Seasonings, Dressings & Saucessector 50

Table 20: Brand Value and Volume-Bouillons & Stocksmarket 52

Table 21: Brand Value and Volume-Chutneys & Relishesmarket 53

Table 22: Brand Value and Volume-Condiment Saucesmarket 54

Table 23: Brand Value and Volume-Dipsmarket 56

Table 24: Brand Value and Volume-Dressingsmarket 57

Table 25: Brand Value and Volume-Dry Cooking Saucesmarket 58

Table 26: Brand Value and Volume-Herbs, Spices & Seasoningsmarket 59

Table 27: Brand Value and Volume-Tomato pastes and puréesmarket 60

Table 28: Brand Value and Volume-Wet Cooking Saucesmarket 61

Table 29: Brand Value and Volume-Gravy Makers (Non-Gravy Granules)category 62

Table 30: Brand Value and Volume-Liquid Stockscategory 62

Table 31: Brand Value and Volume-Stock Cubescategory 62

Table 32: Brand Value and Volume- Sweet Picklecategory 63

Table 33: Brand Value and Volume- Barbecue Saucescategory 64

Table 34: Brand Value and Volume- Chilli/Hot Saucecategory 64

Table 35: Brand Value and Volume-Cocktail Sauces category 64

Table 36: Brand Value and Volume- Fish Sauces category 64

Table 37: Brand Value and Volume- Horseradish Sauces category 64

Table 38: Brand Value and Volume-Mustardscategory 65

Table 39: Brand Value and Volume- Oyster Sauces category 65

Table 40: Brand Value and Volume- Soy-Based Sauce category 65

Table 41: Brand Value and Volume- Tomato Ketchupcategory 66

Table 42: Brand Value and Volume- Other Condiment Saucescategory 66

Table 43: Brand Value and Volume- Cream and Cream-Style Dipscategory 67

Table 44: Brand Value and Volume- Tomato-Based Dipscategory 67

Table 45: Brand Value and Volume- Other Dips category 67

Table 46: Brand Value and Volume- Cream and Cream-Style Dressingscategory 68

Table 47: Brand Value and Volume- Mayonnaisecategory 68

Table 48: Brand Value and Volume- Vinaigrette category 68

Table 49: Brand Value and Volume- Others Dressing category 68

Table 50: Brand Value and Volume- Dry Sauce Mixes category 69

Table 51: Brand Value and Volume- Instant Gravy category 69

Table 52: Brand Value and Volume- Dried Herbscategory 70

Table 53: Brand Value and Volume- Peppercategory 70

Table 54: Brand Value and Volume- Saltcategory 71

Table 55: Brand Value and Volume- Salt Substitutescategory 71

Table 56: Brand Value and Volume- Single & Other Spices category 71

Table 57: Brand Value and Volume- Spice Mixes category 72

Table 58: Brand Value and Volume- Indian Saucescategory 73

Table 59: Brand Value and Volume- Marinadescategory 73

Table 60: Brand Value and Volume- Mexican Saucescategory 73

Table 61: Brand Value and Volume- Oriental Sauces category 73

Table 62: Brand Value and Volume- Pasta Sauces category 73

Table 63: Brand Value and Volume- Other Wet Cooking Sauces category 74

Table 64: Market Definitions 91

Table 65: Category Definitions 92

Table 66: Category Definitions 93

Table 67: Category Definitions 94

Table 68: Category Definitions 95

Table 69: Channel Definitions 96

Table 70: Market Value for Bouillons & Stocks- by category (€ Million), 2011-2021 97

Table 71: Market Value for Chutneys & Relishes- by category (€ Million), 2011-2021 97

Table 72: Market Value forCondiment Sauces- by category (€ Million), 2011-2021 98

Table 73: Market Value for Dips – by category (€ Million), 2011-2021 99

Table 74: Market Value for Dressings – by category (€ Million), 2011-2021 100

Table 75: Market Value forDry Cooking Sauces- bycategory (€ Million), 2011-2021 100

Table 76: Market Value forHerbs, Spices & Seasonings-by category (€ Million), 2011-2021 101

Table 77: Market Value for Tomato Pastes and Purées- by category (€ Million), 2011-2021 101

Table 78: Market Value forWet Cooking Sauces-bycategory (€ Million), 2011-2021 102

Table 79: Market Value for Bouillons & Stocks- by category (US$ Million), 2011-2021 103

Table 80: Market Value for Chutneys & Relishes- by category (US$ Million), 2011-2021 103

Table 81: Market Value forCondiment Sauces- by category (US$ Million), 2011-2021 104

Table 82: Market Value for Dips – by category (US$ Million), 2011-2021 105

Table 83: Market Value for Dressings – by category (US$ Million), 2011-2021 105

Table 84: Market Value forDry Cooking Sauces- by category (US$ Million), 2011-2021 106

Table 85: Market Value forHerbs, Spices & Seasonings-by category (US$ Million), 2011-2021 106

Table 86: Market Value for Tomato Pastes and Purées- by category (US$ Million), 2011-2021 107

Table 87: Market Value forWet Cooking Sauces-by category (US$ Million), 2011-2021 107

Table 88: Market Value for Bouillons & Stocks- by category (Kg Million), 2011-2021 108

Table 89: Market Value for Chutneys & Relishes- by category (Kg Million), 2011-2021 108

Table 90: Market Value forCondiment Sauces- by category (Kg Million), 2011-2021 109

Table 91: Market Value for Dips – by category (Kg Million), 2011-2021 110

Table 92: Market Value for Dressings – by category (Kg Million), 2011-2021 110

Table 93: Market Value forDry Cooking Sauces- by category (Kg Million), 2011-2021 111

Table 94: Market Value forHerbs, Spices & Seasonings-by category (Kg Million), 2011-2021 111

Table 95: Market Value for Tomato Pastes and Purées- by category (Kg Million), 2011-2021 112

Table 96: Market Value forWet Cooking Sauces-by category (Kg Million), 2011-2021 112

Table 97: Seasonings, Dressings & Sauces Sales Distribution in Greece-by Markets (€ Million), 2016 113

Table 98: Packaging Material (in Million pack units) 114

Table 99: Container Type (in Million pack units) 115

Table 100: Closure Type (in Million pack units) 116

Table 101: Outer Type (in Million pack units) 116

Table 102: Exchange Rates: (US$-€), 2011-2021 117

Table 103: GDP Per Capita (€) 117

Table 104: Population 117

Table 105: Consumer Price Index 117

Table 106: Age Profile (Millions of Persons) 118

Figures

List of Figures

Figure 1: Greece compared other top four countries – market size, growth and competitive landscape 12

Figure 2: Market size analysis by value and volume, Seasonings, Dressings & Sauces sector, 2011-2021 13

Figure 3: Per capita consumption of Seasonings, Dressings & Sauces in Greece compared to global and Western Europe average, 2011-2021 14

Figure 4: Value and volume growth analysis by markets, 2016-2021 15

Figure 5: Per capita consumption (by markets) in Greece compared to global and Western Europe average, 2016 17

Figure 6: Growth analysis by value and volume in the Bouillons & Stocksmarket, 2011-2021 18

Figure 7: Value and volume growth analysis, Chutneys & Relishes market, 2011-2021 20

Figure 8: Value and volume growth analysis, Condiment Saucesmarket, 2011-2021 22

Figure 9: Value and volume growth analysis, Dips market, 2011-2021 25

Figure 10: Value and volume growth analysis, Dressings market, 2011-2021 27

Figure 11: Value and volume growth analysis, Dry Cooking Sauces market, 2011-2021 30

Figure 12: Value and volume growth analysis, Herbs, Spices & Seasoningsmarket, 2011-2021 32

Figure 13: Value and volume growth analysis, Tomato Pastes and Puréesmarket, 2011-2021 35

Figure 14: Value and volume growth analysis, Wet Cooking Saucesmarket, 2011-2021 36

Figure 15: Distribution channel share, Seasonings, Dressings & Sauces, 2011-2016 39

Figure 16: Distribution channel share, Bouillons & Stocks market, 2011-2016 40

Figure 17: Distribution channel share, Chutneys & Relishes market, 2011-2016 41

Figure 18: Distribution channel share, Condiment Sauces market, 2011-2016 42

Figure 19: Distribution channel share, Dips market, 2011-2016 43

Figure 20: Distribution channel share, Dressings market, 2011-2016 44

Figure 21: Distribution channel share, Dry Cooking Sauces market, 2011-2016 45

Figure 22: Distribution channel share, Herbs, Spices & Seasonings market, 2011-2016 46

Figure 23: Distribution channel share, Tomato Pastes and Purées market, 2011-2016 47

Figure 24: Distribution channel share, Wet Cooking Sauces market, 2011-2016 48

Figure 25: Leading brands in the GreekSeasonings, Dressings & Sauces sector, value and volume share, 2016 49

Figure 26: Leading brands in the Bouillons & Stocks market, value and volume share, 2016 52

Figure 27: Leading brands in the Chutneys & Relishes market, value and volume share, 2016 53

Figure 28: Leading brands in the Condiment Sauces market, value and volume share, 2016 54

Figure 29: Leading brands in the Dips market, value and volume share, 2016 56

Figure 30: Leading brands in the Dressings market, value and volume share, 2016 57

Figure 31: Leading brands in the Dry Cooking Sauces market, value and volume share, 2016 58

Figure 32: Leading brands in the Herbs, Spices & Seasonings market, value and volume share, 2016 59

Figure 33: Leading brands in the Tomato Pastes and Purées market, value and volume share, 2016 60

Figure 34: Leading brands in the Wet Cooking Sauces market, value and volume share, 2016 61

Figure 35: Packaging share and growth analysis by packaging material, 2011-2021 75

Figure 36: Use of packaging material by markets (in pack units), 2016 76

Figure 37: Packaging share and growth analysis by container type, 2011-2021 77

Figure 38: Use of container type by markets (in pack units), 2016 78

Figure 39: Packaging share and growth analysis by closure type, 2011-2021 79

Figure 40: Use of closure type by markets (in pack units), 2016 80

Figure 41: Packaging share and growth analysis by outer type, 2011-2021 81

Figure 42: Use of outer type by markets (in pack units), 2016 82

Figure 43: Relative comparison of countries based on PEST analysis 83

Figure 44: Greece’s GDP per capita, 2011-2016 86

Figure 45: Population growth in Greece, 2011-2016 87

Figure 46: Consumer Price Index, Greece, 2010-2016 88

Figure 47: Age Profile, Greece, 2016 89

Figure 48: About GlobalData 119

Frequently asked questions

Country Profile: Seasonings, Dressings & Sauces sector in Greece standard reports
Currency USD
$875

Can be used by individual purchaser only

$2,625

Can be shared globally by unlimited users within the purchasing corporation e.g. all employees of a single company


Undecided about purchasing this report?

Enquire Before Buying Request a Free Sample

Get in touch to find out about multi-purchase discounts

reportstore@globaldata.com
Tel +44 20 7947 2745

Every customer’s requirement is unique. With over 220,000 construction projects tracked, we can create a tailored dataset for you based on the types of projects you are looking for. Please get in touch with your specific requirements and we can send you a quote.

Sample Report

Country Profile: Seasonings, Dressings & Sauces sector in Greece was curated by the best experts in the industry and we are confident about its unique quality. However, we want you to make the most beneficial decision for your business, so we offer free sample pages to help you:

  • Assess the relevance of the report
  • Evaluate the quality of the report
  • Justify the cost

Download your copy of the sample report and make an informed decision about whether the full report will provide you with the insights and information you need.

Below is a sample report to understand what you are buying

See what our customers are saying

“The GlobalData platform is our go-to tool for intelligence services. GlobalData provides an easy way to access comprehensive intelligence data around multiple sectors, which essentially makes it a one-for-all intelligence platform, for tendering and approaching customers.

GlobalData is very customer orientated, with a high degree of personalised services, which benefits everyday use. The highly detailed project intelligence and forecast reports can be utilised across multiple departments and workflow scopes, from operational to strategic level, and often support strategic decisions. GlobalData Analytics and visualisation solutions has contributed positively when preparing management presentations and strategic papers.”

Business Intelligence & Marketing Manager, SAL Heavy Lift

“COVID-19 has caused significant interference to our business and the COVID-19 intelligence from GlobalData has helped us reach better decisions around strategy. These two highlights have helped enormously to understand the projections into the future concerning our business units, we also utilise the project database to source new projects for Liebherr-Werk to use as an additional source to pitch for new business.”

Market Analyst & Management, Liebherr-Werk

Your daily news has saved me a lot of time and keeps me up-to-date with what is happening in the market, I like that you almost always have a link to the source origin. We also use your market data in our Strategic Business Process to support our business decisions. By having everything in one place on the Intelligence Center it has saved me a lot of time versus looking on different sources, the alert function also helps with this.

Head of Key Accounts, Saab AB

Having used several other market research companies, I find that GlobalData manages to provide that ‘difficult-to-get’ market data that others can’t, as well as very diverse and complete consumer surveys.

Marketing Intelligence Manager, Portugal Foods

Our experience with GlobalData has been very good, from the platform itself to the people. I find that the analysts and the account team have a high level of customer focus and responsiveness and therefore I can always rely on. The platform is more holistic than other providers. It is convenient and almost like a one stop shop. The pricing suite is highly competitive and value for our organisation.

I like reports that inform new segments such as the analysis on generation Z, millennials, the impact of COVID 19 to our banking customers and their new channel habits. Secondly the specialist insight on affluent sector significantly increases our understanding about this group of customers. The combination of those give us depth and breadth of the evolving market.

I’m in the business of answering and helping people make decisions so with the intelligence center I can do that, effectively and efficiently. I can share quickly key insights that answer and satisfy our country stakeholders by giving them many quality studies and primary research about competitive landscape beyond the outlook of our bank. It helps me be seen as an advisory partner and that makes a big difference. A big benefit of our subscription is that no one holds the whole data and because it allows so many people, so many different parts of our organisation have access, it enables all teams to have the same level of knowledge and decision support.

Head of Customer Insight and Research, Standard Chartered

“I know that I can always rely on Globaldata’s work when I’m searching for the right consumer and market insights. I use Globaldata insights to understand the changing market & consumer landscape and help create better taste & wellbeing solutions for our customers in food, beverage and healthcare industries.

Globaldata has the right data and the reports are of very high quality compared to your competitors. Globaldata not only has overall market sizes & consumer insights on food & beverages but also provides insights at the ingredient & flavour level. That is key for B2B companies like Givaudan. This way we understand our customers’ business and also gain insight to our unique industry”

Head of Consumer Sensory Insights, Givaudan

GlobalData provides a great range of information and reports on various sectors that is highly relevant, timely, easy to access and utilise.  The reports and data dashboards help engagement with clients; they provide valuable industry and market insights that can enrich client conversations and can help in the shaping of value propositions. Moreover, using GlobalData products has helped increase my knowledge of the finance sector, the players within it, and the general threats and opportunities.

I find the consumer surveys that are carried out to be extremely beneficial and not something I have seen anywhere else. They provided an insightful view of why and which consumers take (or don’t) particular financial products. This can help shape conversations with clients to ensure they make the right strategic decisions for their business.

One of the challenges I have found is that data in the payments space is often piecemeal. With GD all of the data I need is in one place, but it also comes with additional market reports that provide useful extra context and information. Having the ability to set-up alerts on relevant movements in the industry, be it competitors or customers, and have them emailed directly to me, ensures I get early sight of industry activity and don’t have to search for news.

Senior Account Manager, TSYS
Go even deeper with GlobalData Intelligence Center

Every Company Report we produce is powered by the GlobalData Intelligence Center.

Subscribing to our intelligence platform means you can monitor developments at Country Profile: Seasonings, Dressings & Sauces sector in Greece in real time.

  • Access a live Country Profile: Seasonings, Dressings & Sauces sector in Greece dashboard for 12 months, with up-to-the-minute insights.
  • Fuel your decision making with real-time deal coverage and media activity.
  • Turn insights on financials, deals, products and pipelines into powerful agents of commercial advantage.