Italy Solar Thermal Power Market Analysis by Size, Installed Capacity, Power Generation, Regulations, Key Players and Forecast to 2035
Powered by ![]()
All the vital news, analysis, and commentary curated by our industry experts.

Italy Solar Thermal Power Market Report Overview
The cumulative installed capacity for solar thermal power in Italy was 0.006 GW in 2022 and is expected to remain the same by the year 2035. The Italy solar thermal power market research report offers comprehensive information and understanding of the solar thermal power market in Italy. The report discusses the renewable power market in the country and provides forecasts up to 2035. The report highlights installed capacity and power generation trends from 2010 to 2035 in the country’s solar thermal power market. Detailed coverage of the renewable energy policy framework governing the market is also provided in the report. The report provides company snapshots of some of the major market participants as well.
Buy the Full Report for More Insights into Italy Solar Thermal Power Market Market Forecast
| Cumulative Installed Capacity (2022) | 0.006 GW |
| Historical Period | 2010-2022 |
| Forecast Period | 2023-2035 |
| Key Deal Types | · Debt Offerings |
| Key Active Plants | · Archimede Solar Thermal Power Plant
· Partanna Solar Thermal Plant · Stromboli Solar Thermal Plant · Sardinia Solar Thermal Project · Chiyoda ASE Solar Thermal Plant |
| Key Companies | · Falck Renewables SpA
· ERG SpA · Enertronica Spa · Enel SpA · Acea SpA |
| Enquire & Decide | Discover the perfect solution for your business needs. Enquire now and let us help you make an informed decision before making a purchase. |
Italy Solar Thermal Power Market Segmentation by Deal Types
The only key deal type in the Italy solar thermal power market is debt offerings.
Buy the Full Report for More Deal Type Insights into Italy Solar Thermal Power Market
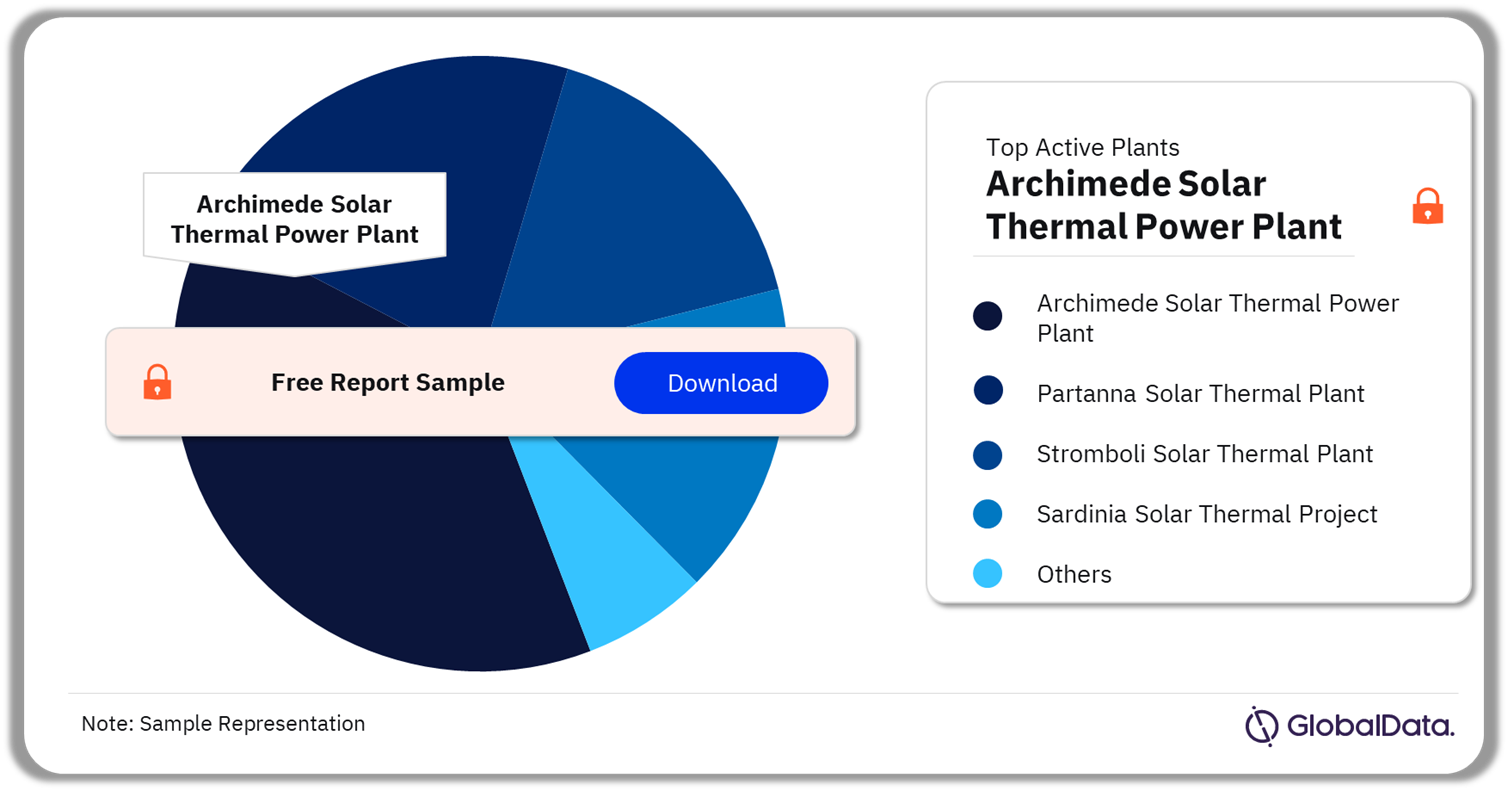
Italy Solar Thermal Power Market - Major Active Plants
The major active plants in the Italy solar thermal power market are Archimede Solar Thermal Power Plant, Partanna Solar Thermal Plant, Stromboli Solar Thermal Plant, Sardinia Solar Thermal Project, and Chiyoda ASE Solar Thermal Plant among others. As of 2023, the Archimede Solar Thermal Power Plant has the highest total capacity.
Italy Solar Thermal Power Market Analysis by Active Plants, 2023 (%)
Buy the Full Report for More Active Plant Insights into Italy Solar Thermal Power Market
Italy Solar Thermal Power Market – Competitive Landscape
The key companies in the Italy solar thermal power market are Falck Renewables SpA, ERG SpA, Enertronica Spa, Enel SpA, and Acea SpA.
Falck Renewables SpA: Falck Renewables SpA (Falck Renewables) is a subsidiary of Falck SpA that develops, designs, constructs and manages energy production plants. The company produces clean energy from various renewable sources including wind energy, solar energy, biomass energy, and waste-to-energy. It also offers various activities such as technical/economic evaluation, pre-feasibility and feasibility studies, design and financial plan including executions such as negotiation and assignment of contracts, preparation of the contract technical specifications and contractual documents, construction supervision, up to operation and maintenance and energy portfolio management activities.
Italy Solar Thermal Power Market Analysis by Companies, 2023

Buy the Full Report for More Company Insights into Italy Solar Thermal Power Market
Segments Covered in The Report
Italy Solar Thermal Power Market Deal Types Outlook (Cumulative Installed Capacity, GW, 2010-2035)
- Debt Offerings
Scope
The report analyses Italy’s solar thermal power market. The scope of the research includes –
- A brief introduction to global carbon emissions and global primary energy consumption.
- An overview of the country’s renewable power market, highlighting installed capacity trends (2010-2035), generation trends (2010-2035), and installed capacity split by various renewable power sources.
- Detailed overview of the country’s solar thermal power market with installed capacity and generation trends, and major active and upcoming solar thermal power projects.
- Deal analysis of the country’s solar thermal power market.
- Key policies and regulatory framework supporting the development of solar thermal power.
- Snapshots of some of the major market participants in the country.
Reasons to Buy
- Enhance your decision-making capability in a more rapid and time-sensitive manner.
- Identify key growth and investment opportunities in the country’s solar thermal power market.
- Facilitate decision-making based on strong historical and forecast data for the solar thermal power market.
- Position yourself to gain the maximum advantage of the industry’s growth potential.
- Develop strategies based on the latest regulatory events.
- Identify key partners and business development avenues.
- Understand and respond to your competitors’ business structure, strategy, and prospects.
Table of Contents
Table
Figures
Frequently asked questions
-
What was the Italy solar thermal power market cumulative installed capacity in 2022?
The cumulative installed capacity for solar thermal power in Italy was 0.006 GW in 2022.
-
Which was the leading deal type in the Italy solar thermal power market in 2022?
Debt offerings was the leading deal type in the Italian solar thermal power market in 2022.
-
Which is the leading active plant in the Italy solar thermal power market?
As of 2023, the Archimede Solar Thermal Power Plant has the highest solar thermal power capacity in Italy.
-
Which are the key companies in the Italian solar thermal power market?
The key companies in the Italian solar thermal power market include Falck Renewables SpA, ERG SpA, Enertronica Spa, Enel SpA, and Acea SpA.
Get in touch to find out about multi-purchase discounts
reportstore@globaldata.com
Tel +44 20 7947 2745
Every customer’s requirement is unique. With over 220,000 construction projects tracked, we can create a tailored dataset for you based on the types of projects you are looking for. Please get in touch with your specific requirements and we can send you a quote.
Sample Report
Italy Solar Thermal Power Market Analysis by Size, Installed Capacity, Power Generation, Regulations, Key Players and Forecast to 2035 was curated by the best experts in the industry and we are confident about its unique quality. However, we want you to make the most beneficial decision for your business, so we offer free sample pages to help you:
- Assess the relevance of the report
- Evaluate the quality of the report
- Justify the cost
Download your copy of the sample report and make an informed decision about whether the full report will provide you with the insights and information you need.


