Ready-to-Drink (RTD) Beverages Market Trends and Analysis by Product Type, Pack Size, Pack Material and Segment Forecast to 2028

Powered by

Access in-depth insight and stay ahead of the market

Accessing the in-depth insights from the ‘Ready-to-Drink (RTD) Beverages’ report can help:

  • Understand the current and future state of the market, allowing businesses to make informed decisions about market entry, product development, and investments
  • Identify competitors’ capabilities to stay ahead in the market
  • Identify segments and get an understanding of various stakeholders across different stages of the entire value chain
  • Anticipate changes in demand and adjust the business development strategies
  • Identify potential regions and countries for growth opportunities

How is our ‘Ready-to-Drink (RTD) Beverages report different from other reports in the market?

  • The report presents in-depth market sizing and forecasts at a segment level for more than 15 countries, including historical and forecast analysis for the period 2018-28 for market assessment.
  • The report offers detailed segmentation by:
    • Product – Alcoholic and Non-Alcoholic
    • Pack Size – 25cl, 33cl, 33.5cl, 50cl, and Others
    • Pack Material – PET, Metal, Glass, Paper & Board, and Others
    • Region – North America, Europe, Asia Pacific, Latin America, and Middle East & Africa
  • The report covers key market drivers and challenges impacting the RTD Beverages market.
  • The report covers mergers & acquisitions (M&A), venture finance, and patent analytics activities dashboards.
  • The competitive landscape includes positioning of key companies and company share analysis in the RTD Beverages market. This can help the stakeholders in the ongoing process of identifying, researching, and evaluating competitors, enabling them to garner insights to shape their business strategies.
  • Competitive profiling and benchmarking of key companies in the market to provide a deeper understanding of industry competition.
  • The report can be a valuable tool for stakeholders to improve their operations, increase customer satisfaction, and maximize profitability by analyzing the latest RTD beverage trends and tracking market growth and demand.

We recommend this valuable source of information to:

  • Soft Drinks Manufacturing Companies
  • Breweries
  • Consulting & Professional Products Firms
  • Venture Capital/Equity Firms

Get a Snapshot of the Ready-to-Drink (RTD) Beverages Market, Download a Free Report Sample

RTD Beverages Market Report Overview

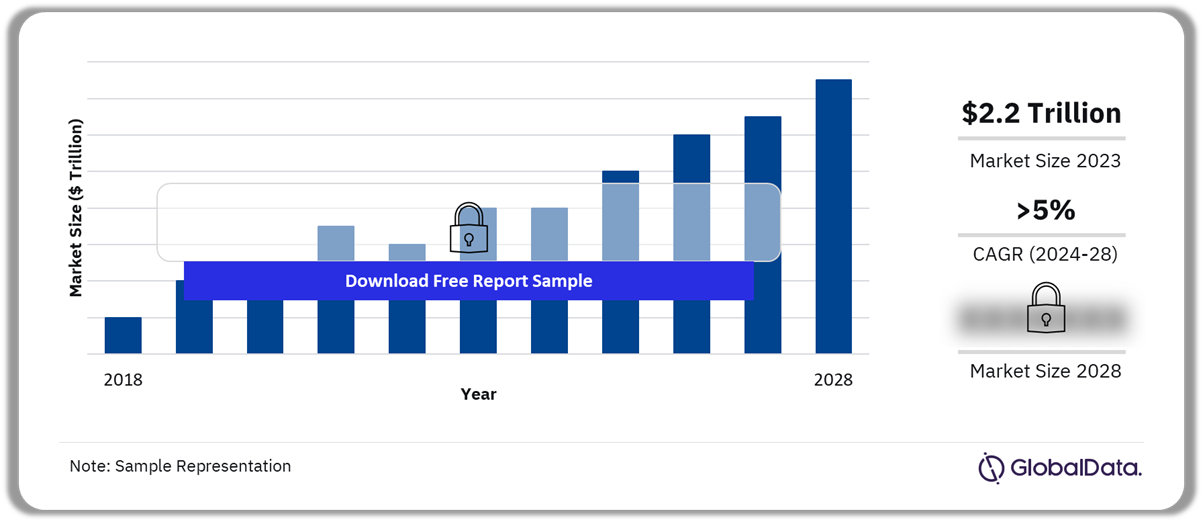
The ready-to-drink (RTD) beverages market was valued at $2.2 trillion in 2023 and is expected to grow at a compound annual growth rate (CAGR) of more than 5% over the forecast period. The rising urbanization rate coupled with the busy lifestyles of consumers has created a demand for convenient and easily accessible food and drinks. RTD beverages effectively meet this demand by providing fast and convenient refreshment solutions for busy urban dwellers. Further, the expansion of distribution channels, including convenience stores, vending machines, and online platforms has enhanced the accessibility of RTD beverages for consumers. The product availability in urban settings, combined with the ease of consumption without any preparation, aligns seamlessly with on-the-go consumption.

Consumers are increasingly focusing on their health & wellness, resulting in a surge in demand for drinks that offer functional benefits such as immune support, energy enhancement, added vitamins, probiotics, and plant-based ingredients. To address this trend, manufacturers are introducing a wide range of healthier ready-to-drink (RTD) options with various nutritional advantages. Examples include natural fruit and vegetable juices, plant-based drinks, and functional drinks fortified with vitamins, minerals, and antioxidants.

RTD Beverages Market Outlook, 2018-2028 ($ Trillion)

RTD Beverages Market Outlook, 2018-2028 ($ Trillion)

Buy the Full Report for Additional Insights on the Ready-to-Drink (RTD) Market Forecast

Download a Free Report Sample

Recently, consumer price inflation has been rising across the world owing to the ongoing geopolitical conflicts which have impacted the consumers’ purchasing power. Value-for-money RTD products provide a balance between price and quality, appealing to price-sensitive consumers seeking affordable options. Manufacturers are focusing on product innovation and new product launches featuring novel ingredients and flavors, thereby offering a unique drinking experience. As a result, consumers are increasingly drawn to these innovative offerings as a cost-effective alternative to dining out at foodservice establishments.

Strong and effective marketing and branding strategies have been instrumental in propelling the expansion of the RTD beverages market. Companies allocate significant resources to advertising, social media, and other promotional endeavors to enhance brand recognition and consumer engagement. These companies utilize multi-platform promotions, personalized marketing events, and pop-up shops to directly engage consumers, enhancing brand visibility and driving sales in the RTD beverages market through tailored experiences and strategic placements.

Despite witnessing healthy growth in recent years, the industry is confronted with numerous constraints that could obstruct its growth potential. Consumers are showing increasing concern about the health risks associated with alcoholic and non-alcoholic drinks. In addition, stringent regulations imposed by regulatory bodies, which demand compliance with rigorous standards concerning product safety, ingredient transparency, labeling accuracy, and advertising practices, pose a challenge to RTD market growth.

Market Size (2023) $2.2 trillion
CAGR (2024 – 2028) >5% from
Forecast Period 2024-2028
Historic Data 2018-2023
Report Scope & Coverage Revenue Forecast, Packaging Volume Forecast, Competitive Landscape, Company Profiling, Growth Trends
Product Alcoholic and Non-Alcoholic
Pack Size 25cl, 33cl, 33.5cl, 50cl, and Others
Pack Material PET, Metal, Glass, Paper & Board, and Others
Regions Americas, Europe, Asia Pacific, Rest of World
Countries China, Japan, India, the Rest of Asia Pacific, Germany, the UK, Russia, the Rest of Europe, the US, Canada, Brazil, Mexico, Colombia, the Rest of Latin America, South Africa, Saudi Arabia, Nigeria, and the Rest of the Middle East & Africa
Key Companies The Coca-Cola Company, AB InBev NV/SA, Danone SA, Diageo PLC, PepsiCo, Inc., Molson Coors Beverage Co., Keurig Dr. Pepper Inc., Asahi Group Ltd., Heineken NV, and Carlsberg AS.
Enquire & Decide Discover the perfect solution for your business needs. Enquire now and let us help you make an informed decision before making a purchase.

RTD Beverages Market Analysis by Product Type

The market has been classified into alcoholic and non-alcoholic, based on product type. In 2023, non-alcoholic products dominated the overall market, driven by changing consumer preferences, health consciousness, and increasing demand for convenience. Busy lifestyles have motivated consumers to seek quick refreshment options, that are easy to carry and consume while on the go.  Carbonates led the non-alcoholic drinks segment owing to their availability in a wide range of flavors, catering to diverse consumer preferences.

The veganism trend is on the rise across the world owing to the growing concerns surrounding animal welfare and health issues associated with dairy consumption. Further, concerns about the environmental impact of animal agriculture, including greenhouse gas emissions and water usage, are encouraging consumers to seek more sustainable options like plant-based beverages offered in ready-to-drink formats.

RTD Beverages Market Share by Product Type, 2023 (%)

RTD Beverages Market Share by Product Type, 2023 (%)

Buy the Full Report for More Information on Ready-to-Drink (RTD) Market by Product Type

Download a Free Report Sample

In terms of growth, the alcoholic beverages segment is expected to register faster growth than the non-alcoholic beverages segment over 2024-28, primarily driven by beer. The growth in the market can be attributed to changing consumer behavior, as individuals seek premium products due to increased disposable income and a desire for sophisticated, high-quality products. Additionally, companies are continuously introducing new flavors, blends, and packaging formats, enhancing the appeal of RTD alcoholic drinks for consumers in search of a unique and enjoyable drinking experience.

RTD Beverages Market Analysis by Pack Size Type

The RTD beverages are catered in a wide range of convenient pack sizes that could fit consumers’ travel packs and are easier to consume.  In 2023, the 50cl pack size type dominated the market, emerging as the most common choice across various product categories including packaged water, carbonates, beer, and still drinks. Other leading pack sizes that witnessed the highest usage include 33cl, 33.5cl, and 25cl in 2023.

The 50cl pack size appeals to consumers who prefer single-serve portions, thereby enabling them to conveniently consume beverages in one go. Further, the pack size is portable enough to carry it easily yet provides adequate quantity to quench thirst and offer satisfactory refreshment. As consumers increasingly prioritize health & wellness, the 50cl pack size enables them to consume beverages in controlled portions, supporting their health-conscious lifestyles.

RTD Beverages Market Share by Pack Size Type, 2023 (%)

RTD Beverages Market Share by Pack Size Type, 2023 (%)

Buy the Full Report for More Information on Ready-to-Drink (RTD) Beverages Market Pack Size Types

Download a Free Report Sample

25cl pack size is expected to register the fastest growth during 2024-28 among leading pack sizes. Smaller packs allow consumers to sample a variety of flavors or brands without needing to purchase a larger pack, promoting experimentation and potentially fostering brand loyalty. Further, consumers are becoming more health-conscious, and smaller packs are perceived to indulge in moderation. Also, 25cl packs are commonly priced lower than larger pack sizes, thereby increasing accessibility to a broader range of consumers.

RTD Beverages Market Analysis by Pack Material Type

PET, glass, metal, and paper & board are the most commonly used pack materials in the RTD beverages market. In 2023, the PET pack material segment held the largest share by volume, primarily due to its lightweight properties, facilitating easy portability of beverage bottles. Furthermore, the transparency and clarity of PET bottles enable consumers to visually inspect the beverage, adding to its appeal and allowing them to evaluate its quality before buying.

The PET segment is anticipated to experience the most rapid expansion among packaging material types in the forecast period. PET is a cost-efficient packaging material when compared to metal and glass, which aids in lowering production expenses and thus the final product’s price. Furthermore, PET bottles are lightweight and flexible in nature, compared to glass and metal, which enhances the portability of RTD beverages.

RTD beverages Market Share by Pack Material Type, 2023 (%)

RTD beverages Market Share by Pack Material Type, 2023 (%)

Buy the Full Report for More Information on Ready-to-Drink (RTD) Beverages Market Pack Material Types

Download a Free Report Sample

Glass and metal containers are quite compatible for catering aerated beverages like beer and carbonates which can endure the pressure exerted by the carbonation without compromising the integrity of the containers. Further, in addition to providing an aesthetic appeal, both glass and metal containers provide excellent barrier properties, blocking the ingress of oxygen and other gases that can degrade the quality of the beverages.

RTD Beverages Market Analysis by Region

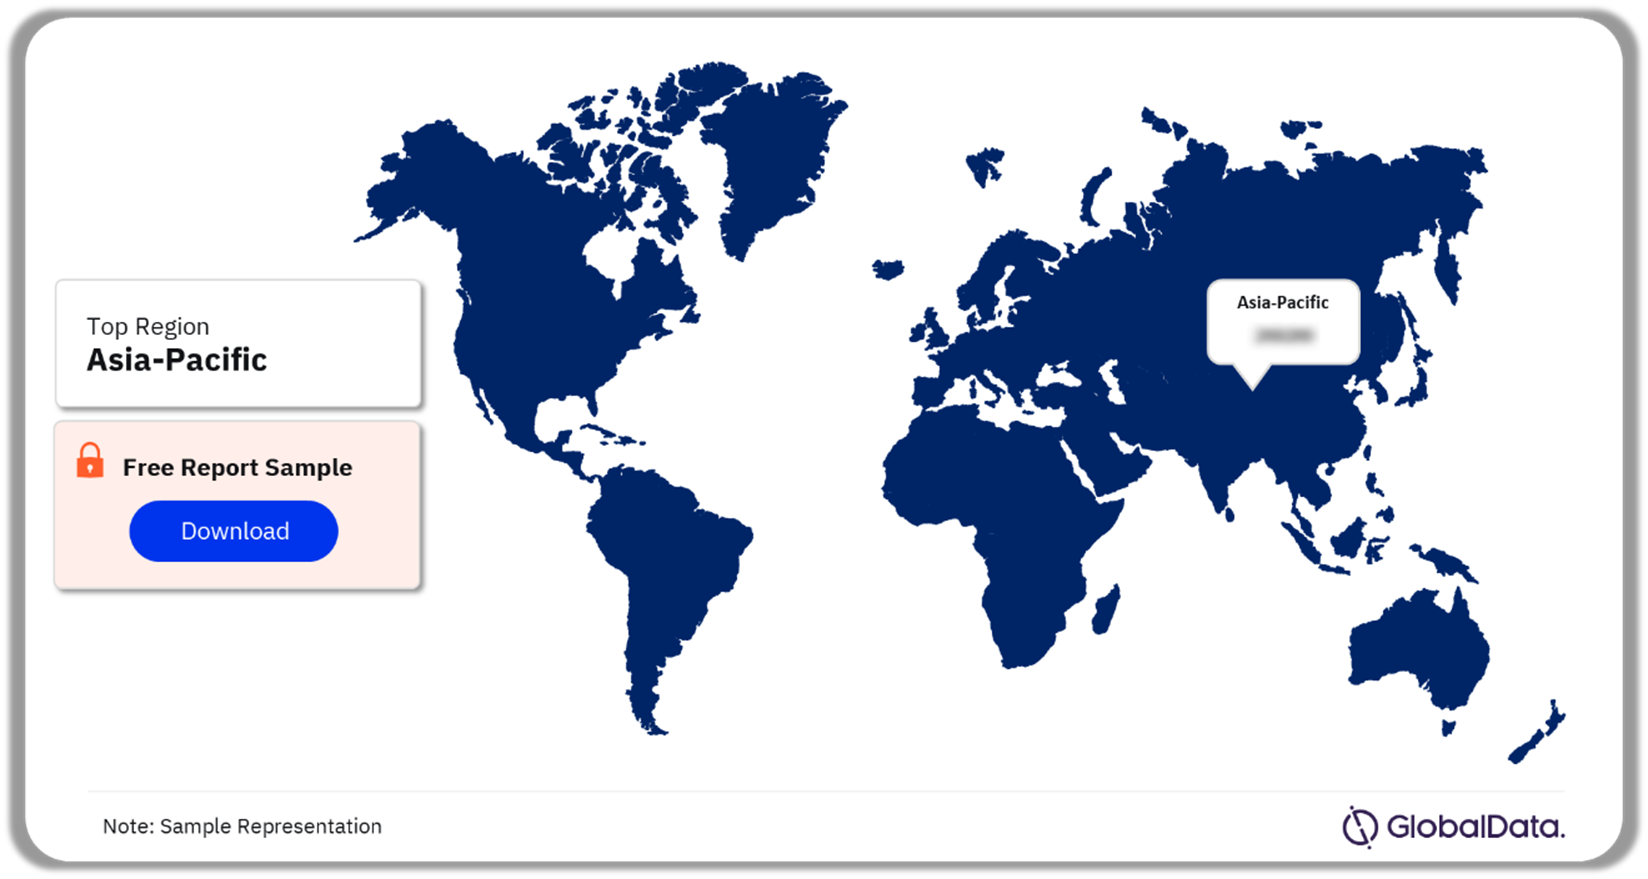
In 2023, the Asia-Pacific region led the RTD beverages market and is projected to maintain its position as the largest market throughout the forecast period. The region includes emerging economies such as India, Vietnam, and Indonesia, all experiencing a notable rise in urbanization. In addition, the region is witnessing significant population growth and expansion of the middle-class population. Moreover, the increasing purchasing power of consumers is facilitating their access to the expanding retail market in the region. The region is home to diverse cultures and tastes, leading to a wide variety of RTD beverage options tailored to different preferences and dietary habits.

The Asia Pacific market is expected to witness the fastest revenue growth over the forecast period, 2024-28. China dominates the market in the region, holding the largest revenue share. This is attributed to its large population base with increasing disposable incomes, which allows consumers to seek premium RTD beverages made with high-quality ingredients. Furthermore, beverage manufacturers in China have been investing significantly in product innovation and marketing initiatives to enhance brand recognition and appeal to consumers.

Asia Pacific Market Share by Country, 2023 (%)

Asia Pacific Market Share by Country, 2023 (%)

Buy the Full Report for Regional Insights into the Ready-to-Drink (RTD) Beverages Market

Download a Free Report Sample

In Asia Pacific, India is set to outpace other countries in the regional market over the forecast period. This is primarily due to the influence of Western culture on India’s large young population, impacting lifestyle trends and beverage consumption habits. India’s extensive and diverse population, with its varied taste preferences, has incentivized manufacturers to provide a broad array of flavors in RTD beverages. In addition, the hot weather conditions in India foster a favorable environment for the industry to thrive, as consumers look for convenient, refreshing, and hydrating options to cope with the heat.

RTD Beverages Market Competitive Landscape

The RTD beverages market is fragmented, with many companies operating across various product types. The market is currently led by established companies, including The Coca-Cola Company, A-BInBev, PepsiCo, Inc., and Heineken, which together accounted for over 31% market share in 2023. The competitive landscape of the market is being shaped by several factors, including changing consumer preferences, innovation, and marketing strategies which have contributed to fueling the competition.

Companies are primarily focusing on innovation and introducing new products with novel ingredients, unique flavors, and convenient packaging to entice consumers. In March 2024, Funk Fluid launched a new beer featuring a blend of guava, banana, and nectarine flavors which could appeal to consumers seeking unusual flavors in this category. Similarly, in October 2023, Asahi Group launched a new bottled water in Japan, which is sold after warming it to about 50-60°C in PET bottles, targeting health-conscious consumers who prefer drinking hot water.

The merger and acquisition (M&A) activities in the RTD beverages sector remain vibrant, with companies vying for dominance. With the rapid expansion of the market, an increase is expected in strategic maneuvers, partnerships, and consolidation. In December 2023, Varun Beverages Ltd., an India-based beverage bottling company acquired The Beverage Company (Proprietary), a South-African RTD non-alcoholic beverages manufacturer for $162.5 million.

Leading Companies in the RTD Beverages Market

  • The Coca-Cola Company
  • A-BInBev
  • PepsiCo, Inc.
  • Heineken NV
  • Molson Coors
  • Carlsberg AS
  • Asahi Group Holdings, Ltd.
  • Diageo PLC
  • Keurig Dr. Pepper Inc.
  • Danone Group

Other RTD beverages Market Companies Mentioned

Kirin Group, Yili Group, Constellation Brands, Suntory Holdings Ltd., Monster Beverage Corporation, Red Bull GmbH, China Mengniu Dairy Co., Ltd., Blue Triton Brands, Diageo plc, Starbucks, Unilever, Groupe Lactalis SA, Thai Beverage Company

Ready-to-Drink (RTD) beverages Market Segments

GlobalData Plc has segmented the RTD beverages market report by product, pack size, pack material, and region:

RTD Beverages Product Type Outlook (Revenue, $ Million, 2018-2028)

  • Alcoholic Beverages
  • Non-Alcoholic Beverages

RTD Beverages Pack Size Type Outlook (Volume, Pack Units Million, 2018-2028)

  • 25cl
  • 5cl
  • 33cl
  • 50cl
  • Others

RTD Beverages Pack Material Type Outlook (Volume, Pack Units Million, 2018-2028)

  • PET
  • Glass
  • Metal
  • Paper & Board
  • Others

RTD Beverages Regional Outlook (Revenue, $ Million, 2018-2028)

  • North America
    • US
    • Canada
  • Europe
    • Germany
    • UK
    • Russia
    • Rest of Europe
  • Asia Pacific
    • China
    • Japan
    • India
    • Rest of Asia Pacific
  • Latin America
    • Brazil
    • Mexico
    • Colombia
    • Rest of Latin America
  • Middle East & Africa
    • South Africa
    • Nigeria
    • Saudi Arabia
    • Rest of the Middle East & Africa

Scope

This report provides overview and service addressable market for RTD beverages market.

It identifies the key trends impacting growth of the market over the next 12 to 24 months, split into four categories: technology trends, macroeconomic trends, consumer trends and regulatory trends.

It includes global market forecasts for the RTD beverages industry and analysis of patents, company filings, and grants.

It features details of recent M&A and VF deals in the RTD beverages market space.

The detailed value chain consists of five main aspects: syrup production, bottling & packaging, distributor

Key Highlights

The Ready-to-Drink (RTD) beverages market was valued at $2.2 trillion in 2023 and is expected to grow at a CAGR of 5.2% over the forecast period. The RTD beverages market report provides an executive-level overview of the current RTD beverages market worldwide, with detailed forecasts of key indicators up to 2028.

Reasons to Buy

This market intelligence report offers a thorough, forward-looking analysis of the global RTD beverages market product type and packaging type and their key opportunities in a concise format to help executives build proactive and profitable growth strategies.

Accompanying GlobalData’s Forecast products, the report examines the assumptions and drivers behind ongoing and upcoming trends in the RTD beverages market.

The report highlights the RTD beverages product type segment (alcoholic beverages and non-alcoholic beverages), pack size type segment (50cl, 33cl, 35.5cl, 25cl, and Others), pack material type segment (PET, Glass, Metal, Paper & Board, and Others) and region.

With more than 50 figures and tables, the report is designed for an executive-level audience, with enhanced presentation quality.

The report provides an easily digestible market assessment for decision-makers built around in-depth information gathered from local market players, which enables executives to quickly get up to speed with the current and emerging trends in the RTD beverages market.

The broad perspective of the report coupled with comprehensive, actionable detail will help soft drinks manufacturers, foodservice vendors, food & beverages technology stakeholders, and other market players succeed in growing the RTD beverages market globally.

Key Players

The Coca-Cola Company
A-BInBev
PepsiCo, Inc.
Diageo PLC
Heineken NV
Molson Coors Beverage Co.
Carlsberg AS
Asahi Group Holdings, Ltd.
Keurig Dr. Pepper Inc.
Danone Group

Table of Contents

Chapter 1 Executive Summary

Chapter 2 Research Scope & Segmentation

    • 2.1. Research Scope & Segmentation
    • 2.2. Market Definitions

Chapter 3 Market Overview & Industry Analysis

  • 3.1. Market Overview
  • 3.2. Ready-to-Drink (RTD) Beverages – Industry Value Chain
  • 3.3. Ready-to-Drink (RTD) Beverages – Market Drivers Analysis
  • 3.4. Ready-to-Drink (RTD) Beverages – Market Challenges Analysis
  • 3.5. Consumer Trends
  • 3.6. Technology Trends
  • 3.7. Macroeconomic Trends
  • 3.8. Regulatory Trends

Chapter 4 Ready-to-Drink (RTD) Beverages Dashboard Analytics

  • 4.1. Merger & Acquisition Analytics
  • 4.2. Venture Finance Analytics
  • 4.3. Patent Analytics

Chapter 5 Ready-to-Drink (RTD) Beverages – Segment Outlook

  • 5.1. Ready-to-Drink (RTD) Beverages Market – Volume Snapshot
  • 5.2. Ready-to-Drink (RTD) Beverages Market – Pack Volume Snapshot
  • 5.3. Ready-to-Drink (RTD) Beverages Market – Revenue by Region
  • 5.4. Ready-to-Drink (RTD) Beverages Market – Revenue by Product Type
  • 5.5. Ready-to-Drink (RTD) Beverages Market – Pack Volume by Region
  • 5.6. Ready-to-Drink (RTD) Beverages Market – Pack Volume by Product Type
  • 5.7. Ready-to-Drink (RTD) Beverages Market – Volume by Pack Size Type
  • 5.8. Ready-to-Drink (RTD) Beverages Market – Volume by Pack Material Type

Chapter 6 Ready-to-Drink (RTD) Beverages- Regional Outlook (Million Units)

  • 6.1. Ready-to-Drink (RTD) Beverages Market – Regional Deep Dive
  • 6.2. Asia Pacific Ready-to-Drink (RTD) Beverages Market Snapshot

    • 6.2.1. Asia Pacific Ready-to-Drink (RTD) Beverages Market Revenue Country, 2018-2028 ($ Billion)
    • 6.2.2. Asia Pacific Ready-to-Drink (RTD) Beverages Market Revenue By Product Type, 2018-2028 ($ Billion)
    • 6.2.3. Asia Pacific Ready-to-Drink (RTD) Beverages Market Volume by Pack Size, 2018-2028 (Billion Pack Units)
    • 6.2.4. Asia Pacific Ready-to-Drink (RTD) Beverages Market Volume by Pack Material, 2018-2028 (Billion Pack Units)
    • 6.2.5. China

      • 6.2.5.1. China Ready-to-Drink (RTD) Beverages Market Revenue By Product Type, 2018-2028 ($ Billion)
      • 6.2.5.2. China Ready-to-Drink (RTD) Beverages Market Volume By Pack Size Type, 2018-2028 (Million Units)
      • 6.2.5.3. China Ready-to-Drink (RTD) Beverages Market Volume By Pack Material Type, 2018-2028 (Million Units)

    • 6.2.6. Japan

      • 6.2.6.1. Japan Ready-to-Drink (RTD) Beverages Market Revenue By Product Type, 2018-2028 ($ Billion)
      • 6.2.6.2. Japan Ready-to-Drink (RTD) Beverages Market Volume By Pack Size Type, 2018-2028 (Million Units)
      • 6.2.6.3. Japan Ready-to-Drink (RTD) Beverages Market Volume By Pack Material Type, 2018-2028 (Million Units)

    • 6.2.7. India

      • 6.2.7.1. India Ready-to-Drink (RTD) Beverages Market Revenue By Product Type, 2018-2028 ($ Billion)
      • 6.2.7.2. India Ready-to-Drink (RTD) Beverages Market Volume By Pack Size Type, 2018-2028 (Million Units)
      • 6.2.7.3. India Ready-to-Drink (RTD) Beverages Market Volume By Pack Material Type, 2018-2028 (Million Units)

    • 6.2.8. Rest of Asia Pacific

      • 6.2.8.1. Rest of Asia Pacific Ready-to-Drink (RTD) Beverages Market Revenue By Product Type, 2018-2028 ($ Billion)
      • 6.2.8.2. Rest of Asia Pacific Ready-to-Drink (RTD) Beverages Market Volume By Pack Size Type, 2018-2028 (Million Units)
      • 6.2.8.3. Rest of Asia Pacific Ready-to-Drink (RTD) Beverages Market Volume By Pack Material Type, 2018-2028 (Million Units)

  • 6.3. Europe Ready-to-Drink (RTD) Beverages Market Snapshot

    • 6.3.1. Europe Ready-to-Drink (RTD) Beverages Market Revenue Country, 2018-2028 ($ Billion)
    • 6.3.2. Europe Ready-to-Drink (RTD) Beverages Market Revenue By Product Type, 2018-2028 ($ Billion)
    • 6.3.3. Europe Ready-to-Drink (RTD) Beverages Market Volume by Pack Size, 2018-2028 (Billion Pack Units)
    • 6.3.4. Europe Ready-to-Drink (RTD) Beverages Market Volume by Pack Material, 2018-2028 (Billion Pack Units)
    • 6.3.5. Germany

      • 6.3.5.1. Germany Ready-to-Drink (RTD) Beverages Market Revenue By Product Type, 2018-2028 ($ Billion)
      • 6.3.5.2. Germany Ready-to-Drink (RTD) Beverages Market Volume By Pack Size Type, 2018-2028 (Million Units)
      • 6.3.5.3. Germany Ready-to-Drink (RTD) Beverages Market Volume By Pack Material Type, 2018-2028 (Million Units)

    • 6.3.6. UK

      • 6.3.6.1. UK Ready-to-Drink (RTD) Beverages Market Revenue By Product Type, 2018-2028 ($ Billion)
      • 6.3.6.2. UK Ready-to-Drink (RTD) Beverages Market Volume By Pack Size Type, 2018-2028 (Million Units)
      • 6.3.6.3. UK Ready-to-Drink (RTD) Beverages Market Volume By Pack Material Type, 2018-2028 (Million Units)

    • 6.3.7. Russia

      • 6.3.7.1. Russia Ready-to-Drink (RTD) Beverages Market Revenue By Product Type, 2018-2028 ($ Billion)
      • 6.3.7.2. Russia Ready-to-Drink (RTD) Beverages Market Volume By Pack Size Type, 2018-2028 (Million Units)
      • 6.3.7.3. Russia Ready-to-Drink (RTD) Beverages Market Volume By Pack Material Type, 2018-2028 (Million Units)

    • 6.3.8. Rest of Europe

      • 6.3.8.1. Rest of Europe Ready-to-Drink (RTD) Beverages Market Revenue By Product Type, 2018-2028 ($ Billion)
      • 6.3.8.2. Rest of Europe Ready-to-Drink (RTD) Beverages Market Volume By Pack Size Type, 2018-2028 (Million Units)
      • 6.3.8.3. Rest of Europe Ready-to-Drink (RTD) Beverages Market Volume By Pack Material Type, 2018-2028 (Million Units)

  • 6.4. North America Ready-to-Drink (RTD) Beverages Market Snapshot

    • 6.4.1. North America Ready-to-Drink (RTD) Beverages Market Revenue Country, 2018-2028 ($ Billion)
    • 6.4.2. North America Ready-to-Drink (RTD) Beverages Market Revenue By Product Type, 2018-2028 ($ Billion)
    • 6.4.3. North America Ready-to-Drink (RTD) Beverages Market Volume by Pack Size, 2018-2028 (Billion Pack Units)
    • 6.4.4. North America Ready-to-Drink (RTD) Beverages Market Volume by Pack Material, 2018-2028 (Billion Pack Units)
    • 6.4.5. US

      • 6.4.5.1. US Ready-to-Drink (RTD) Beverages Market Revenue By Product Type, 2018-2028 ($ Billion)
      • 6.4.5.2. US Ready-to-Drink (RTD) Beverages Market Volume By Pack Size Type, 2018-2028 (Million Units)
      • 6.4.5.3. US Ready-to-Drink (RTD) Beverages Market Volume By Pack Material Type, 2018-2028 (Million Units)

    • 6.4.6. Canada

      • 6.4.6.1. Canada Ready-to-Drink (RTD) Beverages Market Revenue By Product Type, 2018-2028 ($ Billion)
      • 6.4.6.2. Canada Ready-to-Drink (RTD) Beverages Market Volume By Pack Size Type, 2018-2028 (Million Units)
      • 6.4.6.3. Canada Ready-to-Drink (RTD) Beverages Market Volume By Pack Material Type, 2018-2028 (Million Units)

  • 6.5. Latin America Ready-to-Drink (RTD) Beverages Market Snapshot

    • 6.5.1. Latin America Ready-to-Drink (RTD) Beverages Market Revenue Country, 2018-2028 ($ Billion)
    • 6.5.2. Latin America Ready-to-Drink (RTD) Beverages Market Revenue By Product Type, 2018-2028 ($ Billion)
    • 6.5.3. Latin America Ready-to-Drink (RTD) Beverages Market Volume by Pack Size, 2018-2028 (Billion Pack Units)
    • 6.5.4. Latin America Ready-to-Drink (RTD) Beverages Market Volume by Pack Material, 2018-2028 (Billion Pack Units)
    • 6.5.5. Brazil

      • 6.5.5.1. Brazil Ready-to-Drink (RTD) Beverages Market Revenue By Product Type, 2018-2028 ($ Billion)
      • 6.5.5.2. Brazil Ready-to-Drink (RTD) Beverages Market Volume By Pack Size Type, 2018-2028 (Million Units)
      • 6.5.5.3. Brazil Ready-to-Drink (RTD) Beverages Market Volume By Pack Material Type, 2018-2028 (Million Units)

    • 6.5.6. Mexico

      • 6.5.6.1. Mexico Ready-to-Drink (RTD) Beverages Market Revenue By Product Type, 2018-2028 ($ Billion)
      • 6.5.6.2. Mexico Ready-to-Drink (RTD) Beverages Market Volume By Pack Size Type, 2018-2028 (Million Units)
      • 6.5.6.3. Mexico Ready-to-Drink (RTD) Beverages Market Volume By Pack Material Type, 2018-2028 (Million Units)

    • 6.5.7. Colombia

      • 6.5.7.1. Colombia Ready-to-Drink (RTD) Beverages Market Revenue By Product Type, 2018-2028 ($ Billion)
      • 6.5.7.2. Colombia Ready-to-Drink (RTD) Beverages Market Volume By Pack Size Type, 2018-2028 (Million Units)
      • 6.5.7.3. Colombia Ready-to-Drink (RTD) Beverages Market Volume By Pack Material Type, 2018-2028 (Million Units)

    • 6.5.8. Rest of Latin America

      • 6.5.8.1. Rest of Latin America Ready-to-Drink (RTD) Beverages Market Revenue By Product Type, 2018-2028 ($ Billion)
      • 6.5.8.2. Rest of Latin America Ready-to-Drink (RTD) Beverages Market Volume By Pack Size Type, 2018-2028 (Million Units)
      • 6.5.8.3. Rest of Latin America Ready-to-Drink (RTD) Beverages Market Volume By Pack Material Type, 2018-2028 (Million Units)

  • 6.6. Middle East & Africa Ready-to-Drink (RTD) Beverages Market Snapshot

    • 6.6.1. Middle East & Africa Ready-to-Drink (RTD) Beverages Market Revenue Country, 2018-2028 ($ Billion)
    • 6.6.2. Middle East & Africa Ready-to-Drink (RTD) Beverages Market Revenue By Product Type, 2018-2028 ($ Billion)
    • 6.6.3. Middle East & Africa Ready-to-Drink (RTD) Beverages Market Volume by Pack Size, 2018-2028 (Billion Pack Units)
    • 6.6.4. Middle East & Africa Ready-to-Drink (RTD) Beverages Market Volume by Pack Material, 2018-2028 (Billion Pack Units)
    • 6.6.5. South Africa

      • 6.6.5.1. South Africa Ready-to-Drink (RTD) Beverages Market Revenue By Product Type, 2018-2028 ($ Billion)
      • 6.6.5.2. South Africa Ready-to-Drink (RTD) Beverages Market Volume By Pack Size Type, 2018-2028 (Million Units)
      • 6.6.5.3. South Africa Ready-to-Drink (RTD) Beverages Market Volume By Pack Material Type, 2018-2028 (Million Units)

    • 6.6.6. Nigeria

      • 6.6.6.1. Nigeria Ready-to-Drink (RTD) Beverages Market Revenue By Product Type, 2018-2028 ($ Billion)
      • 6.6.6.2. Nigeria Ready-to-Drink (RTD) Beverages Market Volume By Pack Size Type, 2018-2028 (Million Units)
      • 6.6.6.3. Nigeria Ready-to-Drink (RTD) Beverages Market Volume By Pack Material Type, 2018-2028 (Million Units)

    • 6.6.7. Saudi Arabia

      • 6.6.7.1. Saudi Arabia Ready-to-Drink (RTD) Beverages Market Revenue By Product Type, 2018-2028 ($ Billion)
      • 6.6.7.2. Saudi Arabia Ready-to-Drink (RTD) Beverages Market Volume By Pack Size Type, 2018-2028 (Million Units)
      • 6.6.7.3. Saudi Arabia Ready-to-Drink (RTD) Beverages Market Volume By Pack Material Type, 2018-2028 (Million Units)

    • 6.6.8. Rest of Middle East & Africa

      • 6.6.8.1. Rest of Middle East & Africa Ready-to-Drink (RTD) Beverages Market Revenue By Product Type, 2018-2028 ($ Billion)
      • 6.6.8.2. Rest of Middle East & Africa Ready-to-Drink (RTD) Beverages Market Volume By Pack Size Type, 2018-2028 (Million Units)
      • 6.6.8.3. Rest of Middle East & Africa Ready-to-Drink (RTD) Beverages Market Volume By Pack Material Type, 2018-2028 (Million Units)

Chapter 7 Ready-to-Drink (RTD) Beverages- Competitive Landscape

  • 7.1. Ready-to-Drink (RTD) Beverages Market – Competitive Landscape
  • 7.2. Non-Alcoholic Beverages Ready-to-Drink (RTD) Beverages Vendors – Competitive Landscape
  • 7.3. Alcoholic Beverages Ready-to-Drink (RTD) Beverages Vendors – Competitive Landscape
  • 7.4. Asia Pacific Ready-to-Drink (RTD) Beverages Vendors – Competitive Landscape
  • 7.5. North America Ready-to-Drink (RTD) Beverages Vendors – Competitive Landscape
  • 7.6. Europe Ready-to-Drink (RTD) Beverages Vendors – Competitive Landscape
  • 7.7. Latin America Ready-to-Drink (RTD) Beverages Vendors – Competitive Landscape
  • 7.8. Middle East & Africa Ready-to-Drink (RTD) Beverages Vendors – Competitive Landscape

Chapter 8 Ready-to-Drink (RTD) Beverages – Company Profiles

  • 8.1. The Coca-Cola Company

    • 8.1.1. The Coca-Cola Company – Company Overview
    • 8.1.2. The Coca-Cola Company – Financial Performance
    • 8.1.3. The Coca-Cola Company – Key Employees

  • 8.2. AB InBev NV/SA

    • 8.2.1. AB InBev NV/SA – Company Overview
    • 8.2.2. AB InBev NV/SA – Financial Performance
    • 8.2.3. AB InBev NV/SA – Key Employees

  • 8.3. Danone SA

    • 8.3.1. Danone SA – Company Overview
    • 8.3.2. Danone SA – Financial Performance
    • 8.3.3. Danone SA – Key Employees

  • 8.4. Diageo PLC

    • 8.4.1. Diageo PLC- Company Overview
    • 8.4.2. Diageo PLC- Financial Performance
    • 8.4.3. Diageo PLC- Key Employees

  • 8.5. PepsiCo, Inc.

    • 8.5.1. PepsiCo, Inc.- Company Overview
    • 8.5.2. PepsiCo, Inc.- Financial Performance
    • 8.5.3. PepsiCo, Inc.- Key Employees

  • 8.6. Molson Coors Beverage Co.

    • 8.6.1. Molson Coors Beverage Co. – Company Overview
    • 8.6.2. Molson Coors Beverage Co. – Financial Performance
    • 8.6.3. Molson Coors Beverage Co. – Key Employees

  • 8.7. Keurig Dr Pepper Inc.

    • 8.7.1. Keurig Dr Pepper Inc. – Company Overview
    • 8.7.2. Keurig Dr Pepper Inc. – Financial Performance
    • 8.7.3. Keurig Dr Pepper Inc. – Key Employees

  • 8.8. Asahi Group Ltd.

    • 8.8.1. Asahi Group Ltd.- Company Overview
    • 8.8.2. Asahi Group Ltd.- Financial Performance
    • 8.8.3. Asahi Group Ltd.- Key Employees

  • 8.9. Heineken NV

    • 8.9.1. Heineken NV – Company Overview
    • 8.9.2. Heineken NV – Financial Performance
    • 8.9.3. Heineken NV – Key Employees

  • 8.10. Carlsberg AS

    • 8.10.1. Carlsberg AS- Company Overview
    • 8.10.2. Carlsberg AS- Financial Performance
    • 8.10.3. Carlsberg AS- Key Employees

Chapter 9 Research Methodology

  • 9.1. Research Methodology Steps
  • 9.2. Market Study
  • 9.3. Research
  • 9.4. Analysis
  • 9.5. Quality Control

Chapter 10 About GlobalData

Table

  • Table 1 List of Key Companies, By Product Type
  • Table 2 Top 5 M&A Deals in RTD Beverages Market, 2020-2023
  • Table 3 Top 5 VF Deals in RTD Beverages Market, 2020-2023

Figures

  • Fig 1 Top Ready-to-Drink (RTD) Beverages country markets, 2023 vs 2028
  • Fig 2 RTD Beverages Market CAGR by Product Type, 2024-28
  • Fig 3 Major Trends Impacting the Ready-to-Drink (RTD) Beverages Market
  • Fig 4 Ready-to-Drink (RTD) Beverages Market – Segmentation
  • Fig 5 Consumer Survey – Spending on RTD Beverages, Q1 2024
  • Fig 6 Value Chain – Non-Alcoholic Beverages
  • Fig 7 Value Chain – Alcoholic Beverages
  • Fig 8 Deal Volume: Ready-to-Drink (RTD) Beverages M&A Deals, 2020-2023
  • Fig 9 Deal Value: Ready-to-Drink (RTD) Beverages M&A Deals, 2020-2023 ($M)
  • Fig 10 Geographical Distribution: Ready-to-Drink (RTD) Beverages Deals (volume %), 2020-2023
  • Fig 11 Geographical Distribution: Ready-to-Drink (RTD) Beverages Deals, 2020-2023
  • Fig 12 Deal Volume: Ready-to-Drink (RTD) Beverages VF Deals, 2020-2023
  • Fig 13 Deal Volume: Ready-to-Drink (RTD) Beverages VF Deals ($M), 2020-2023
  • Fig 14 Geographical Distribution: Ready-to-Drink (RTD) Beverages VF Deals (volume %), 2020-2023
  • Fig 15 Geographical Distribution: Ready-to-Drink (RTD) Beverages VF Deals, 2020-2023
  • Fig 16 Filing/Grant Trends in Ready-to-Drink (RTD) Beverages, 2021-2023
  • Fig 17 Ready-to-Drink (RTD) Beverages Patents: Trending Sectors by Total Publications, 2020-2023
  • Fig 18 Geographical Distribution: Ready-to-Drink (RTD) Beverages Patents by Total Publication (%), 2020- 2023
  • Fig 19 Top Patent Assignee for Ready-to-Drink (RTD) Beverages by Total Publications, 2020-2023
  • Fig 20 Geographical Distribution: Ready-to-Drink (RTD) Beverages Patents across all Sectors by Total Publications, 2019-2022
  • Fig 21 Ready-to-Drink (RTD) Beverages Market – Revenue Forecast, 2018-28 ($ Billion)
  • Fig 22 Ready-to-Drink (RTD) Beverages Market – Volume Forecast, 2018-28 (Billion Units)
  • Fig 23 Ready-to-Drink (RTD) Beverages Market by Region – Revenue Forecast, 2018-28 ($ Billion)
  • Fig 24 Ready-to-Drink (RTD) Beverages Market by Region – Volume Forecast, 2018-28 (Billion Units)
  • Fig 25 Ready-to-Drink (RTD) Beverages Market by Product Type – Revenue Forecast, 2018-28 ($ Billion)
  • Fig 26 Ready-to-Drink (RTD) Beverages Market by Product Type – Volume Forecast, 2018-28 (Billion Units)
  • Fig 27 Ready-to-Drink (RTD) Beverages Market by Pack Size – Volume Forecast, 2018-28 (Billion Units)
  • Fig 28 Ready-to-Drink (RTD) Beverages Market by Pack Material – Volume Forecast, 2018-28 (Billion Units)
  • Fig 29 Asia Pacific Ready-to-Drink (RTD) Beverages Market – Revenue Forecast, 2018-28 ($ Billion)
  • Fig 30 Asia Pacific Ready-to-Drink (RTD) Beverages Market, By Country – Revenue Forecast, 2018-28 ($ Billion)
  • Fig 31 Asia Pacific Ready-to-Drink (RTD) Beverages Market, By Product Type – Revenue Forecast, 2018-28 ($ Billion)
  • Fig 32 Asia Pacific Ready-to-Drink (RTD) Beverages Market, By Pack Size – Volume Forecast, 2018-28 (Billion Units)
  • Fig 33 Asia Pacific Ready-to-Drink (RTD) Beverages Market, By Pack Material – Volume Forecast, 2018-28 (Billion Units)
  • Fig 34 China Ready-to-Drink (RTD) Beverages Market Revenue, By Product Type, 2018-28 ($ Billion)
  • Fig 35 China Ready-to-Drink (RTD) Beverages Market Volume, By Pack Size, 2018-28 (Billion Units)
  • Fig 36 China Ready-to-Drink (RTD) Beverages Market Volume, By Pack Material, 2018-28 (Billion Units)
  • Fig 37 Japan Ready-to-Drink (RTD) Beverages Market Revenue, By Product Type, 2018-28 ($ Billion)
  • Fig 38 Japan Ready-to-Drink (RTD) Beverages Market Volume, By Pack Size, 2018-28 (Billion Units)
  • Fig 39 Japan Ready-to-Drink (RTD) Beverages Market Volume, By Pack Material, 2018-28 (Billion Units
  • Fig 40 India Ready-to-Drink (RTD) Beverages Market Revenue, By Product Type, 2018-28 ($ Billion)
  • Fig 41 India Ready-to-Drink (RTD) Beverages Market Volume, By Pack Size, 2018-28 (Billion Units)
  • Fig 42 India Ready-to-Drink (RTD) Beverages Market Volume, By Pack Material, 2018-28 (Billion Units
  • Fig 43 Rest of APAC Ready-to-Drink (RTD) Beverages Market Revenue, By Product Type, 2018-28 ($ Billion)
  • Fig 44 Rest of APAC Ready-to-Drink (RTD) Beverages Market Volume, By Pack Size, 2018-28 (Billion Units)
  • Fig 45 Rest of APAC Ready-to-Drink (RTD) Beverages Market Volume, By Pack Material, 2018-28 (Billion Units
  • Fig 46 North America Ready-to-Drink (RTD) Beverages Market – Revenue Forecast, 2018-28 ($ Billion)
  • Fig 47 North America Ready-to-Drink (RTD) Beverages Market, By Country – Revenue Forecast, 2018-28 ($ Billion)
  • Fig 48 North America Ready-to-Drink (RTD) Beverages Market, By Product Type – Revenue Forecast, 2018-28 ($ Billion)
  • Fig 49 North America Ready-to-Drink (RTD) Beverages Market, By Pack Size – Volume Forecast, 2018-28 (Billion Units)
  • Fig 50 North America Ready-to-Drink (RTD) Beverages Market, By Pack Material – Volume Forecast, 2018-28 (Billion Units)
  • Fig 51 US Ready-to-Drink (RTD) Beverages Market Revenue, By Product Type, 2018-28 ($ Billion)
  • Fig 52 US Ready-to-Drink (RTD) Beverages Market Volume, By Pack Size, 2018-28 (Billion Units)
  • Fig 53 US Ready-to-Drink (RTD) Beverages Market Volume, By Pack Material, 2018-28 (Billion Units)
  • Fig 54 Canada Ready-to-Drink (RTD) Beverages Market Revenue, By Product Type, 2018-28 ($ Billion)
  • Fig 55 Canada Ready-to-Drink (RTD) Beverages Market Volume, By Pack Size, 2018-28 (Billion Units)
  • Fig 56 Canada Ready-to-Drink (RTD) Beverages Market Volume, By Pack Material, 2018-28 (Billion Units
  • Fig 57 Europe Ready-to-Drink (RTD) Beverages Market – Revenue Forecast, 2018-28 ($ Billion)
  • Fig 58 Europe Ready-to-Drink (RTD) Beverages Market, By Country – Revenue Forecast, 2018-28 ($ Billion)
  • Fig 59 Europe Ready-to-Drink (RTD) Beverages Market, By Product Type – Revenue Forecast, 2018-28 ($ Billion)
  • Fig 60 Europe Ready-to-Drink (RTD) Beverages Market, By Pack Size – Volume Forecast, 2018-28 (Billion Units)
  • Fig 61 Europe Ready-to-Drink (RTD) Beverages Market, By Pack Material – Volume Forecast, 2018-28 (Billion Units)
  • Fig 62 Germany Ready-to-Drink (RTD) Beverages Market Revenue, By Product Type, 2018-28 ($ Billion)
  • Fig 63 Germany Ready-to-Drink (RTD) Beverages Market Volume, By Pack Size, 2018-28 (Billion Units)
  • Fig 64 Germany Ready-to-Drink (RTD) Beverages Market Volume, By Pack Material, 2018-28 (Billion Units)
  • Fig 65 UK Ready-to-Drink (RTD) Beverages Market Revenue, By Product Type, 2018-28 ($ Billion)
  • Fig 66 UK Ready-to-Drink (RTD) Beverages Market Volume, By Pack Size, 2018-28 (Billion Units)
  • Fig 67 UK Ready-to-Drink (RTD) Beverages Market Volume, By Pack Material, 2018-28 (Billion Units
  • Fig 68 Russia Ready-to-Drink (RTD) Beverages Market Revenue, By Product Type, 2018-28 ($ Billion)
  • Fig 69 Russia Ready-to-Drink (RTD) Beverages Market Volume, By Pack Size, 2018-28 (Billion Units)
  • Fig 70 Russia Ready-to-Drink (RTD) Beverages Market Volume, By Pack Material, 2018-28 (Billion Units
  • Fig 71 Rest of Europe Ready-to-Drink (RTD) Beverages Market Revenue, By Product Type, 2018-28 ($ Billion)
  • Fig 72 Rest of Europe Ready-to-Drink (RTD) Beverages Market Volume, By Pack Size, 2018-28 (Billion Units)
  • Fig 73 Rest of Europe Ready-to-Drink (RTD) Beverages Market Volume, By Pack Material, 2018-28 (Billion Units
  • Fig 74 Latin America Ready-to-Drink (RTD) Beverages Market – Revenue Forecast, 2018-28 ($ Billion)
  • Fig 75 Latin America Ready-to-Drink (RTD) Beverages Market, By Country – Revenue Forecast, 2018-28 ($ Billion)
  • Fig 76 Latin America Ready-to-Drink (RTD) Beverages Market, By Product Type – Revenue Forecast, 2018-28 ($ Billion)
  • Fig 77 Latin America Ready-to-Drink (RTD) Beverages Market, By Pack Size – Volume Forecast, 2018-28 (Billion Units)
  • Fig 78 Latin America Ready-to-Drink (RTD) Beverages Market, By Pack Material – Volume Forecast, 2018-28 (Billion Units)
  • Fig 79 Brazil Ready-to-Drink (RTD) Beverages Market Revenue, By Product Type, 2018-28 ($ Billion)
  • Fig 80 Brazil Ready-to-Drink (RTD) Beverages Market Volume, By Pack Size, 2018-28 (Billion Units)
  • Fig 81 Brazil Ready-to-Drink (RTD) Beverages Market Volume, By Pack Material, 2018-28 (Billion Units)
  • Fig 82 Mexico Ready-to-Drink (RTD) Beverages Market Revenue, By Product Type, 2018-28 ($ Billion)
  • Fig 83 Mexico Ready-to-Drink (RTD) Beverages Market Volume, By Pack Size, 2018-28 (Billion Units)
  • Fig 84 Mexico Ready-to-Drink (RTD) Beverages Market Volume, By Pack Material, 2018-28 (Billion Units
  • Fig 85 Colombia Ready-to-Drink (RTD) Beverages Market Revenue, By Product Type, 2018-28 ($ Billion)
  • Fig 86 Colombia Ready-to-Drink (RTD) Beverages Market Volume, By Pack Size, 2018-28 (Billion Units)
  • Fig 87 Colombia Ready-to-Drink (RTD) Beverages Market Volume, By Pack Material, 2018-28 (Billion Units
  • Fig 88 Rest of Latin America Ready-to-Drink (RTD) Beverages Market Revenue, By Product Type, 2018-28 ($ Billion)
  • Fig 89 Rest of Latin America Ready-to-Drink (RTD) Beverages Market Volume, By Pack Size, 2018-28 (Billion Units)
  • Fig 90 Rest of Latin America Ready-to-Drink (RTD) Beverages Market Volume, By Pack Material, 2018-28 (Billion Units)
  • Fig 91 Middle East & Africa Ready-to-Drink (RTD) Beverages Market – Revenue Forecast, 2018-28 ($ Billion)
  • Fig 92 Middle East & Africa Ready-to-Drink (RTD) Beverages Market, By Country – Revenue Forecast, 2018-28 ($ Billion)
  • Fig 93 Middle East & Africa Ready-to-Drink (RTD) Beverages Market, By Product Type – Revenue Forecast, 2018-28 ($ Billion)
  • Fig 94 Middle East & Africa Ready-to-Drink (RTD) Beverages Market, By Pack Size – Volume Forecast, 2018-28 (Billion Units)
  • Fig 95 Middle East & Africa Ready-to-Drink (RTD) Beverages Market, By Pack Material – Volume Forecast, 2018-28 (Billion Units)
  • Fig 96 South Africa Ready-to-Drink (RTD) Beverages Market Revenue, By Product Type, 2018-28 ($ Billion)
  • Fig 97 South Africa Ready-to-Drink (RTD) Beverages Market Volume, By Pack Size, 2018-28 (Billion Units)
  • Fig 98 South Africa Ready-to-Drink (RTD) Beverages Market Volume, By Pack Material, 2018-28 (Billion Units)
  • Fig 99 Nigeria Ready-to-Drink (RTD) Beverages Market Revenue, By Product Type, 2018-28 ($ Billion)
  • Fig 100 Nigeria Ready-to-Drink (RTD) Beverages Market Volume, By Pack Size, 2018-28 (Billion Units)
  • Fig 101 Nigeria Ready-to-Drink (RTD) Beverages Market Volume, By Pack Material, 2018-28 (Billion Units
  • Fig 102 Saudi Arabia Ready-to-Drink (RTD) Beverages Market Revenue, By Product Type, 2018-28 ($ Billion)
  • Fig 103 Saudi Arabia Ready-to-Drink (RTD) Beverages Market Volume, By Pack Size, 2018-28 (Billion Units)
  • Fig 104 Saudi Arabia Ready-to-Drink (RTD) Beverages Market Volume, By Pack Material, 2018-28 (Billion Units
  • Fig 105 Rest of Middle East & Africa Ready-to-Drink (RTD) Beverages Market Revenue, By Product Type, 2018-28 ($ Billion)
  • Fig 106 Rest of Middle East & Africa Ready-to-Drink (RTD) Beverages Market Volume, By Pack Size, 2018-28 (Billion Units)
  • Fig 107 Rest of Middle East & Africa Ready-to-Drink (RTD) Beverages Market Volume, By Pack Material, 2018-28 (Billion Units)
  • Fig 108 Top 10 Ready-to-Drink (RTD) Beverages Vendors by Revenue Share, 2023
  • Fig 109 Top 10 Non-Alcoholic Ready-to-Drink (RTD) Beverages Vendors by Revenue Share, 2023
  • Fig 110 Top 10 Alcoholic Ready-to-Drink (RTD) Beverages Vendors by Revenue Share, 2023
  • Fig 111 Asia Pacific – Top 10 Ready-to-Drink (RTD) Beverages Vendors by Revenue Share, 2023
  • Fig 112 North America – Top 10 Ready-to-Drink (RTD) Beverages Vendors by Revenue Share, 2023
  • Fig 113 Europe – Top 10 Ready-to-Drink (RTD) Beverages Vendors by Revenue Share, 2023
  • Fig 114 Middle East & Africa – Top 10 Ready-to-Drink (RTD) Beverages Vendors by Revenue Share, 2023
  • Fig 115 Latin America – Top 10 Ready-to-Drink (RTD) Beverages Vendors by Revenue Share, 2023

Frequently asked questions

Currency USD
$3,950

Can be used by individual purchaser only

$7,950

Can be shared globally by unlimited users within the purchasing corporation e.g. all employees of a single company


Undecided about purchasing this report?

Enquire Before Buying Request a Free Sample

Get in touch to find out about multi-purchase discounts

reportstore@globaldata.com
Tel +44 20 7947 2745

Every customer’s requirement is unique. With over 220,000 construction projects tracked, we can create a tailored dataset for you based on the types of projects you are looking for. Please get in touch with your specific requirements and we can send you a quote.

Sample Report

We are confident about Ready-to-Drink (RTD) Beverages Market Trends and Analysis by Product Type, Pack Size, Pack Material and Segment Forecast to 2028 report's unique quality. However, we want you to make the most beneficial decision for your business, so we offer free sample pages to help you:

  • Assess the relevance of the report
  • Evaluate the quality of the report
  • Justify the cost

Download your copy of the sample report and make an informed decision about whether the full report will provide you with the insights and information you need.

Below is a sample report to understand what you are buying

See what our customers are saying
testimonial-image
testimonial-image
testimonial-image
testimonial-image
testimonial-image
testimonial-image
testimonial-image

“The GlobalData platform is our go-to tool for intelligence services. GlobalData provides an easy way to access comprehensive intelligence data around multiple sectors, which essentially makes it a one-for-all intelligence platform, for tendering and approaching customers.

GlobalData is very customer orientated, with a high degree of personalised services, which benefits everyday use. The highly detailed project intelligence and forecast reports can be utilised across multiple departments and workflow scopes, from operational to strategic level, and often support strategic decisions. GlobalData Analytics and visualisation solutions has contributed positively when preparing management presentations and strategic papers.”

Business Intelligence & Marketing Manager, SAL Heavy Lift

“COVID-19 has caused significant interference to our business and the COVID-19 intelligence from GlobalData has helped us reach better decisions around strategy. These two highlights have helped enormously to understand the projections into the future concerning our business units, we also utilise the project database to source new projects for Liebherr-Werk to use as an additional source to pitch for new business.”

Market Analyst & Management, Liebherr-Werk

Your daily news has saved me a lot of time and keeps me up-to-date with what is happening in the market, I like that you almost always have a link to the source origin. We also use your market data in our Strategic Business Process to support our business decisions. By having everything in one place on the Intelligence Center it has saved me a lot of time versus looking on different sources, the alert function also helps with this.

Head of Key Accounts, Saab AB

Having used several other market research companies, I find that GlobalData manages to provide that ‘difficult-to-get’ market data that others can’t, as well as very diverse and complete consumer surveys.

Marketing Intelligence Manager, Portugal Foods

Our experience with GlobalData has been very good, from the platform itself to the people. I find that the analysts and the account team have a high level of customer focus and responsiveness and therefore I can always rely on. The platform is more holistic than other providers. It is convenient and almost like a one stop shop. The pricing suite is highly competitive and value for our organisation.

I like reports that inform new segments such as the analysis on generation Z, millennials, the impact of COVID 19 to our banking customers and their new channel habits. Secondly the specialist insight on affluent sector significantly increases our understanding about this group of customers. The combination of those give us depth and breadth of the evolving market.

I’m in the business of answering and helping people make decisions so with the intelligence center I can do that, effectively and efficiently. I can share quickly key insights that answer and satisfy our country stakeholders by giving them many quality studies and primary research about competitive landscape beyond the outlook of our bank. It helps me be seen as an advisory partner and that makes a big difference. A big benefit of our subscription is that no one holds the whole data and because it allows so many people, so many different parts of our organisation have access, it enables all teams to have the same level of knowledge and decision support.

Head of Customer Insight and Research, Standard Chartered

“I know that I can always rely on Globaldata’s work when I’m searching for the right consumer and market insights. I use Globaldata insights to understand the changing market & consumer landscape and help create better taste & wellbeing solutions for our customers in food, beverage and healthcare industries.

Globaldata has the right data and the reports are of very high quality compared to your competitors. Globaldata not only has overall market sizes & consumer insights on food & beverages but also provides insights at the ingredient & flavour level. That is key for B2B companies like Givaudan. This way we understand our customers’ business and also gain insight to our unique industry”

Head of Consumer Sensory Insights, Givaudan

GlobalData provides a great range of information and reports on various sectors that is highly relevant, timely, easy to access and utilise.  The reports and data dashboards help engagement with clients; they provide valuable industry and market insights that can enrich client conversations and can help in the shaping of value propositions. Moreover, using GlobalData products has helped increase my knowledge of the finance sector, the players within it, and the general threats and opportunities.

I find the consumer surveys that are carried out to be extremely beneficial and not something I have seen anywhere else. They provided an insightful view of why and which consumers take (or don’t) particular financial products. This can help shape conversations with clients to ensure they make the right strategic decisions for their business.

One of the challenges I have found is that data in the payments space is often piecemeal. With GD all of the data I need is in one place, but it also comes with additional market reports that provide useful extra context and information. Having the ability to set-up alerts on relevant movements in the industry, be it competitors or customers, and have them emailed directly to me, ensures I get early sight of industry activity and don’t have to search for news.

Senior Account Manager, TSYS
Go even deeper with GlobalData Intelligence Center

Every Company Report we produce is powered by the GlobalData Intelligence Center.

Subscribing to our intelligence platform means you can monitor developments at Ready-to-Drink (RTD) Beverages Market Trends and Analysis by Product Type, Pack Size, Pack Material and Segment Forecast to 2028 in real time.

  • Access a live Ready-to-Drink (RTD) Beverages Market Trends and Analysis by Product Type, Pack Size, Pack Material and Segment Forecast to 2028 dashboard for 12 months, with up-to-the-minute insights.
  • Fuel your decision making with real-time deal coverage and media activity.
  • Turn insights on financials, deals, products and pipelines into powerful agents of commercial advantage.