Chile Beverages Consumption Trends and Forecasts Tracker, Q4 2023
Powered by ![]()
All the vital news, analysis, and commentary curated by our industry experts.

Chile Beverages Market Overview
The Chile beverages market size was 2.39 billion liters (BL) in Q4 2023. The Chile beverages market research report offers comprehensive consumption volume data across several beverage categories for Q4 2023. Furthermore, the report precisely lists new product launches and highlights the latest beverage industry performance and developments every quarter.
The Chile beverages market outlook also identifies key factors influencing consumer purchasing behavior. For instance, the alcoholic drinks sector was less in demand amid inflation and weak consumer sentiment, as price-sensitive Chileans restricted their spending on these beverages.
Buy the Full Report for More Insights on the Chile Beverages Market Forecast,
Download a Free Sample Report
Chile Beverages Market Segmentation by Categories
Chile Beverages Market Analysis by Categories, Q4 2023 (%)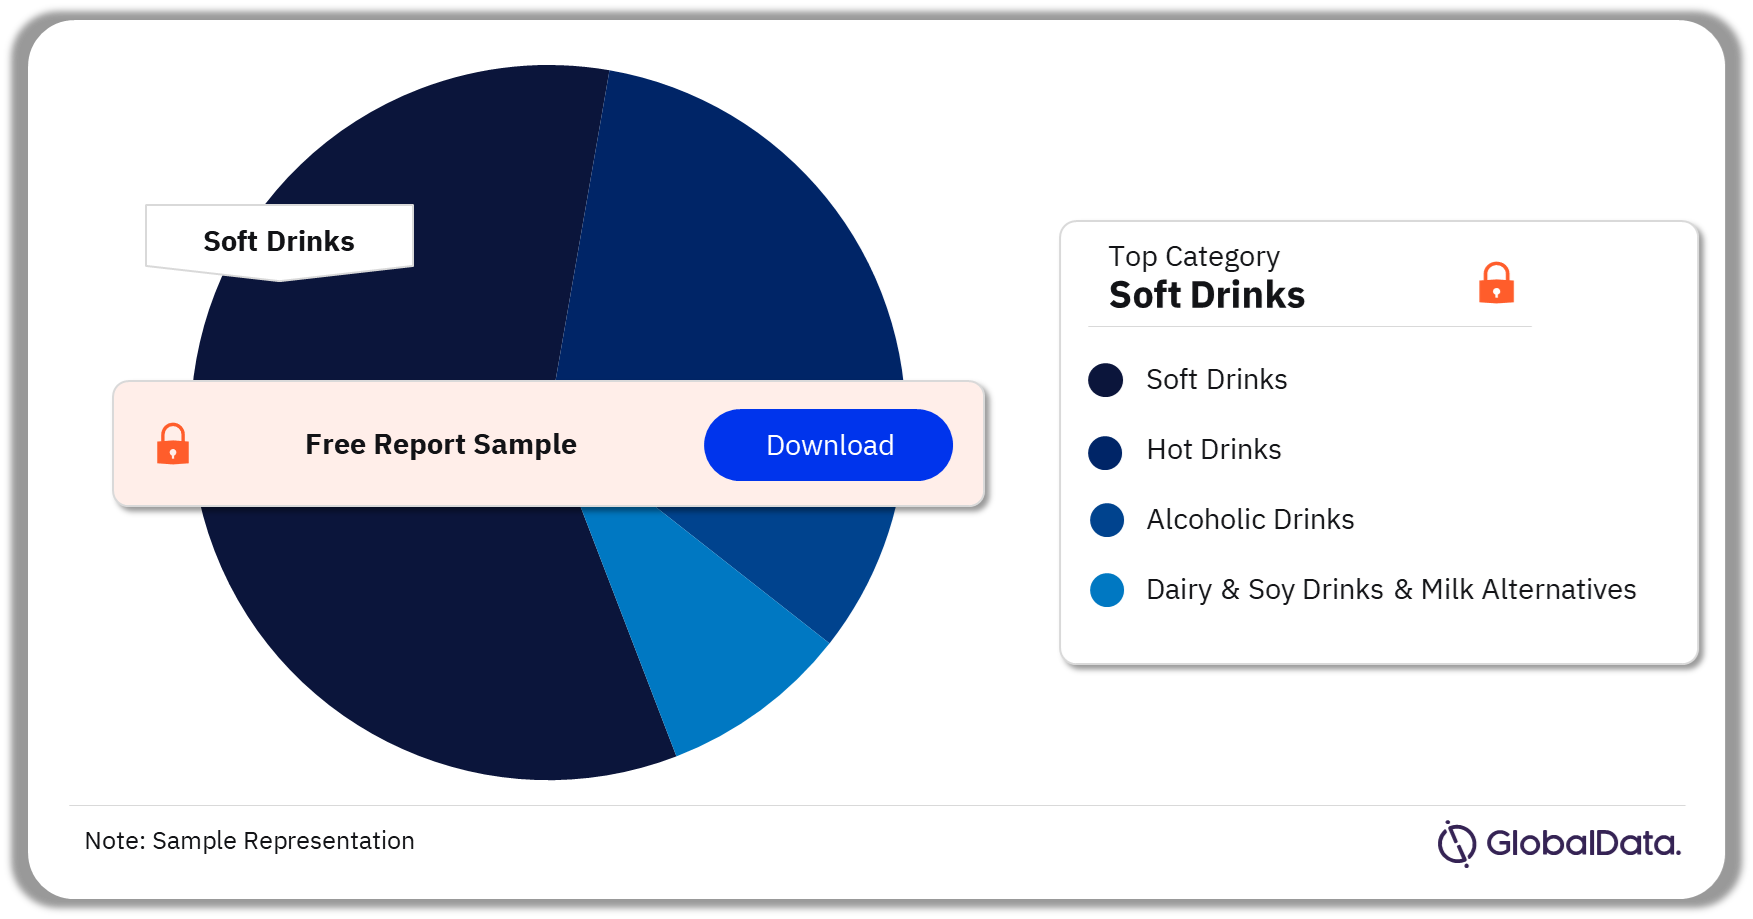
Buy the Full Report for More Category Insights into the Chile Beverages Market,
Download a Free Sample Report
Soft drinks, hot drinks, and alcoholic drinks among others are the primary Chile beverages market categories. In Q4 2023, soft drinks accounted for the highest beverages market share in Chile.
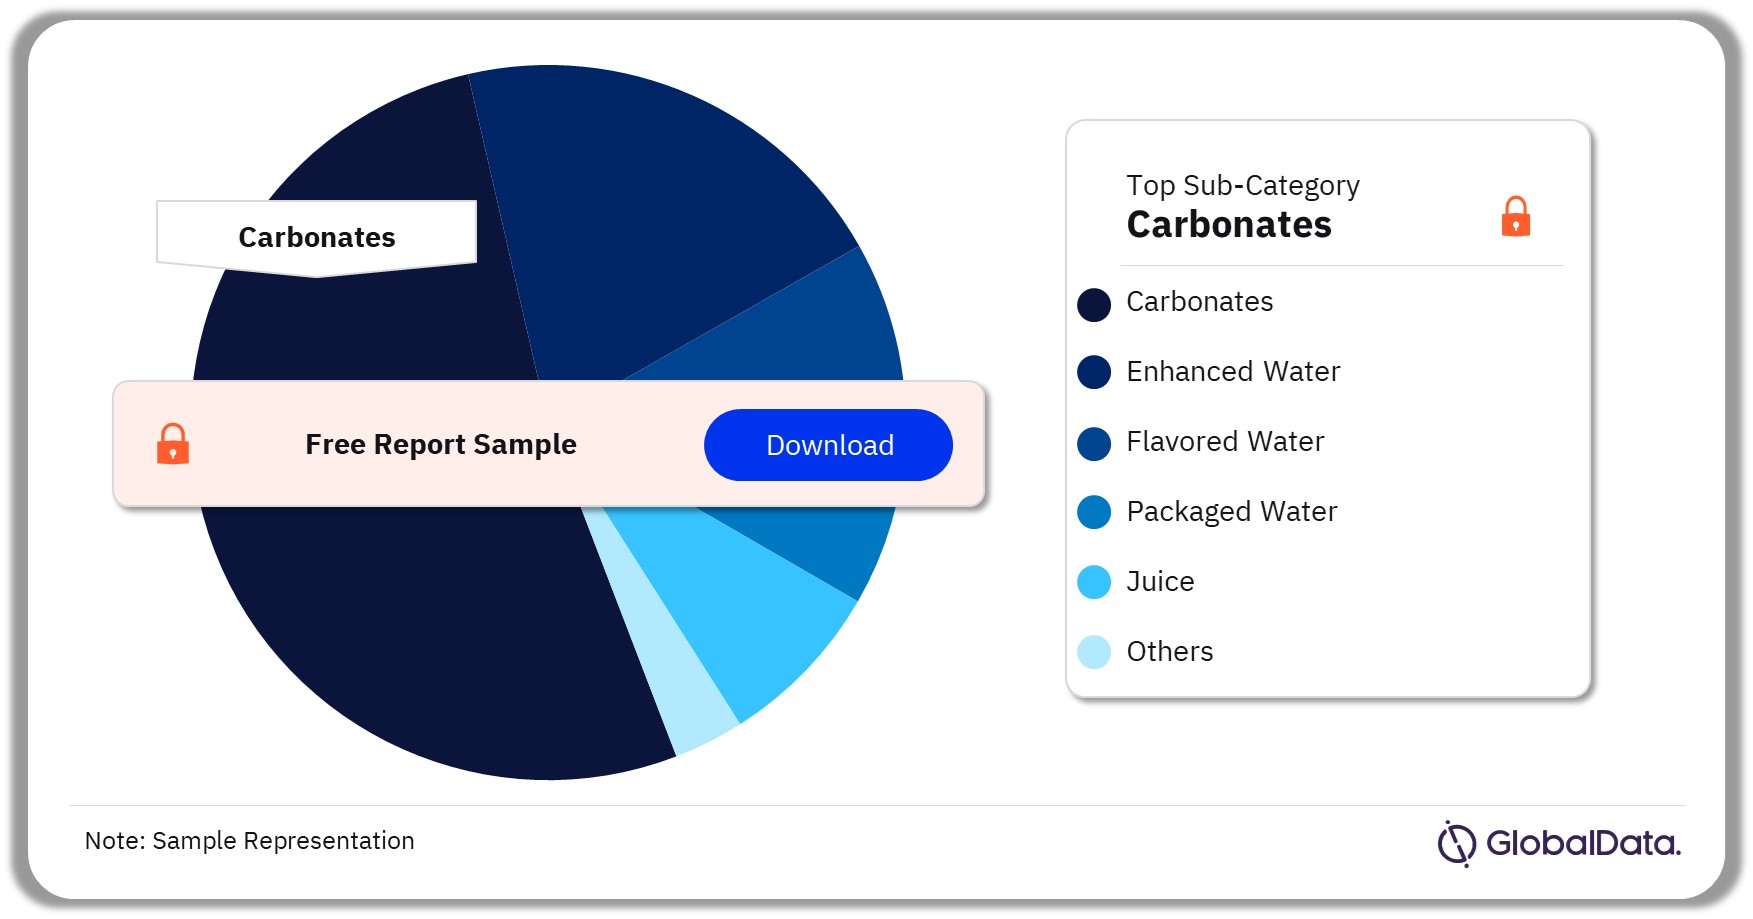
Soft drinks: The primary sub-categories are packaged water, enhanced water, flavored water, carbonates, and juice among others. Carbonates accounted for the highest consumption volume in Q4 2023. In the long term, economic growth and an improvement in consumers’ purchasing power will strongly support the category’s performance. Furthermore, efforts by leading manufacturers to promote low-calorie offerings will also yield positive results in the long term.
Soft Drinks Beverages Market Analysis by Sub-Categories, Q4 2023 (%)
Buy the Full Report for More Sub-Category Insights into the Chile Beverages Market,
Download a Free Sample Report
Hot drinks: Hot coffee, hot tea, and other hot drinks are the main sub-categories within the hot drinks sector. Hot tea was the most consumed sub-category in Q4 2023. Increased consumption at on-premise outlets along with tourism growth positively impacted the sector’s performance.
Dairy and soy drinks and milk alternatives: The key sub-categories are condensed milk, drinking yogurt, and fermented milk among others. Among the segments, white milk accounted for the highest volume in Q4 2023.
Alcoholic drinks: Beer, cider, and fortified wine, among others are the main sub-categories. In Q4 2023, beer was the leading sub-category with the highest consumption volume.
| Time Period | Q4 2023 |
| Consumption Volume (Q4 2023) | 2.39 billion liters (BL) |
| Key Segments | · Soft Drinks
· Hot Drinks · Dairy and Soy Drinks and Milk Alternatives · Alcoholic Drinks |
| Enquire & Decide | Discover the perfect solution for your business needs. Enquire now and let us help you make an informed decision before making a purchase. |
Segments Covered in the Report
Chile Beverages Market Segments Outlook (Volume, Billion Liters, Q4 2023)
- Soft Drinks
- Packaged Water
- Enhanced Water
- Flavored Water
- Carbonates
- Juice
- Nectars
- Still Drinks
- Squash/Syrups
- Iced/RTD Tea Drinks
- Sports drinks
- Energy Drinks
- Bulk/HOD Water
- Hot Drinks
- Hot Coffee
- Hot Tea
- Other Hot Drinks
- Dairy and Soy Drinks and Milk Alternatives
- Condensed Milk
- Drinking Yogurt
- Evaporated Milk
- Fermented Milk
- Flavored Milk
- Grain, Nut, Rice and Seed Milk Alternative Drinks
- Soymilk
- White Milk
- Alcoholic Drinks
- Beer
- Cider
- Flavored Alcoholic Beverages
- Fortified Wine
- Brandy
- Gin & Genever
- Liqueurs
- Rum
- Sparkling Wine
- Specialty Spirits
- Still Wine
- Tequila & Mezcal
- Vodka
- Whiskey
Scope
The report provides:
- Comparison of consumption volumes for Q4 2023 vs Q4 2022 and moving annual totals (MAT). Preliminary data for the full year of 2022, and predictions for 2023 across all beverage categories.
- Carbonates consumption data for Q4 2023 vs Q4 2022 and moving annual totals (MAT). Preliminary data for 2022, and predictions for 2023 by regular vs low-calorie, and primary flavor.
- An economic mood indicator with industry confidence levels assessment, private label performance vs brands, and price trends.
- Latest quarterly trends and assumptions for 2023 with valuable analyzed drivers.
Reasons to Buy
- Learn about the latest trends in Chile’s beverage industry to help with your strategic planning.
- Investigate the latest quarterly and emerging annual trends in Chile to back your marketing initiatives.
- Examine the 2023 prediction for the beverage sector to make knowledgeable choices about your firm’s future in the industry.
- View a selection of the key quarterly new soft drinks product launches and identify competitor activity.
- Access a quarterly Special Focus on a current industry ‘hot topic’ offering qualitative insight from local consultants to determine opportunities for product innovation.
Table of Contents
Frequently asked questions
-
What was the Chile beverages market consumption volume in Q4 2023?
The beverage market consumption volume in Chile was 2.39 billion liters (BL) in Q4 2023.
-
What are the key categories in the Chile beverages market?
The key categories in the Chile beverages market are soft drinks, hot drinks, and alcoholic drinks among others.
-
Which was the leading category in the Chile beverages market in Q4 2023?
In Q4 2023, soft drinks was the leading category in the Chile beverages market.
-
Which are the key sub-segments in the soft drinks category?
The primary sub-categories are packaged water, enhanced water, flavored water, carbonates, and juice among others.
Get in touch to find out about multi-purchase discounts
reportstore@globaldata.com
Tel +44 20 7947 2745
Every customer’s requirement is unique. With over 220,000 construction projects tracked, we can create a tailored dataset for you based on the types of projects you are looking for. Please get in touch with your specific requirements and we can send you a quote.
Sample Report
Chile Beverages Consumption Trends and Forecasts Tracker, Q4 2023 was curated by the best experts in the industry and we are confident about its unique quality. However, we want you to make the most beneficial decision for your business, so we offer free sample pages to help you:
- Assess the relevance of the report
- Evaluate the quality of the report
- Justify the cost
Download your copy of the sample report and make an informed decision about whether the full report will provide you with the insights and information you need.


