Non-Alcoholic Beverages Packaging Industry Trends, Opportunities, Growth Analysis and Forecast to 2028
Powered by ![]()
All the vital news, analysis, and commentary curated by our industry experts.

Reasons to buy the ‘Non-Alcoholic Beverages Packaging’ report:
- Get an overview of the usage of different pack materials across the non-alcoholic beverages industry in terms of the number of units, packaging share, and growth rates during 2018-2028
- The report provides an overview of the external packaging influences and change in consumption levels by region between 2018-28
- Access key packaging innovations for pack materials and pack types
- Data and analysis including the number of units (millions) and growth rates for five-pack materials viz. rigid plastics, rigid metal, paper & board, flexible packaging, and others.
- Pack sub-type, pack type, closure material, closure type, primary outer material, and primary outer type.
How is our ‘Non-Alcoholic Beverages Packaging Market’ report unique from other reports in the market?
- Manufacturers and retailers seek the latest information on the evolution of the market to formulate their sales and marketing strategies.
- This report fulfills the demand for authentic market data with a high level of detail. It provides its readers with up-to-date information and analysis to uncover emerging growth opportunities within the industry globally.
- The report provides a detailed analysis of the countries in specific regions, covering the key challenges, and future growth opportunities that can help companies gain insight into the country/region-specific nuances.
- The analysts have placed a significant emphasis on the key trends that drive consumer choice and the future opportunities that can be explored in the region, which can help companies in revenue expansion.
We recommend this valuable source of information to anyone involved in:
- Food and Beverage Packaging Value Chain Stakeholders
- Food and Beverage Suppliers/Food Delivery Aggregators/Foodservice Vendors
- Raw Material Manufacturers and Suppliers
- Packaging Leaders, Startups, Agencies, Associations, and Organizations
- Business Development and Market Intelligence
- Investment Analysts and Portfolio Managers
- Professional Services – Investment Banks, PE/VC firms
- M&A/Investment, Management Consultants, and Consulting Firms
To Get a Snapshot of the Non-Alcoholic Beverages Packaging Market Report
Download a Free Sample Report
Non-Alcoholic Beverages Packaging Industry Report Overview
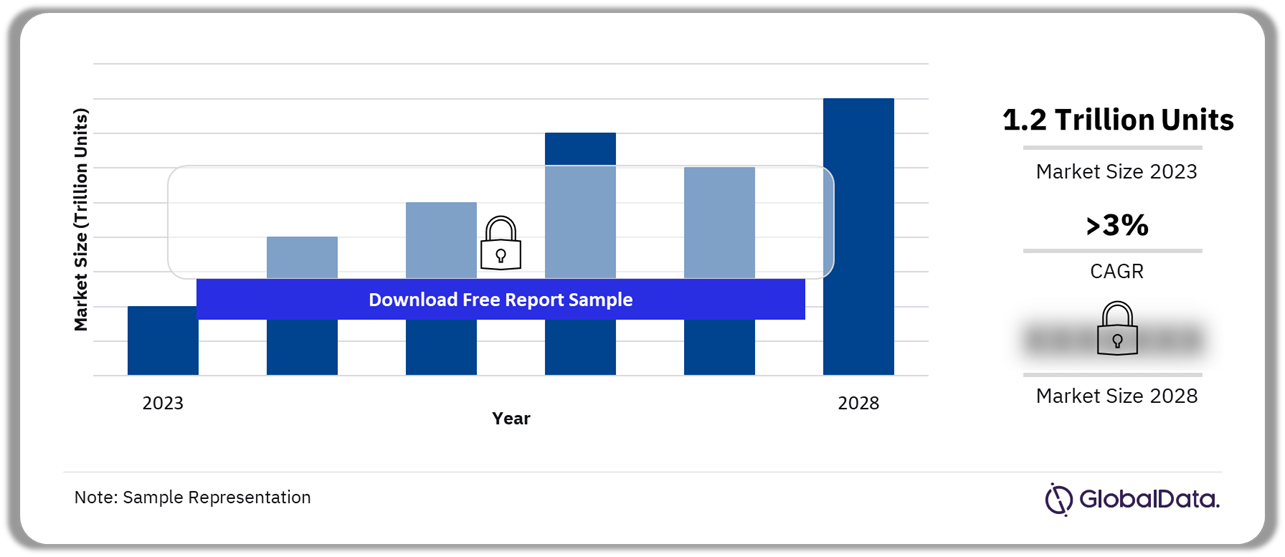
The non-alcoholic beverages packaging market size was 1.2 trillion units in 2023. The market will garner a CAGR of more than 3% during 2023-2028. The non-alcoholic beverages packaging market report brings together multiple data sources to provide a comprehensive overview of the non-alcoholic beverages packaging industry.
Non-Alcoholic Beverages Packaging Industry Outlook 2023-2028 (Trillion Units)
Buy the Full Report for More Insights on Non-Alcoholic Beverages Packaging Market Forecasts
Download a Free Sample Report
The report provides an overview of the packaging industry at the global level. The analysis also provides a regional overview across five regions highlighting key sectors and growth drivers as well as a pack material overview for select countries in each region.
| Market Size (2023) | 1.2 trillion units |
| CAGR (2023-2028) | >3% |
| Historical Period | 2018-2023 |
| Forecast Period | 2023-2028 |
| Key Sectors | · Soft Drinks
· Hot Drinks |
| Key Pack Materials | · Rigid Plastics
· Rigid Metal · Paper & Board · Flexible Packaging · Glass |
| Key Region | · Asia-Pacific
· Middle East & Africa · The Americas · Western Europe · Eastern Europe |
| Enquire & Decide | Discover the perfect solution for your business needs. Enquire now and let us help you make an informed decision before making a purchase. |
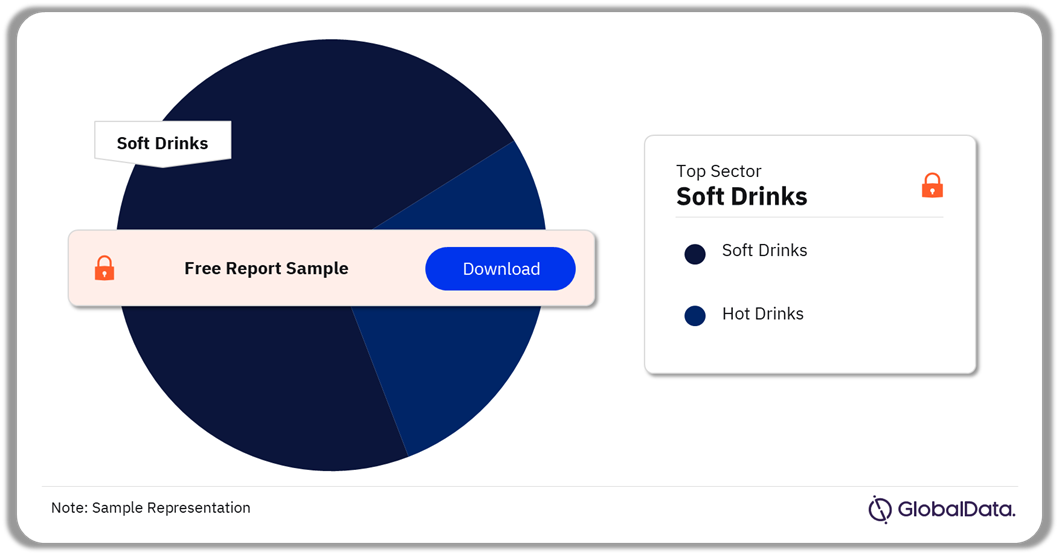
Non-Alcoholic Beverages Packaging Market Segmentation by Sectors
The key sectors in the non-alcoholic beverage packaging market are soft drinks and hot drinks. In 2023, the soft drinks sector held the largest non-alcoholic beverages packaging market share.
Non-Alcoholic Beverages Packaging Market Analysis by Sector, 2023 (%)
 Buy the Full Report for More Sector Insights into the Non-Alcoholic Beverages Packaging Market Download a Free Sample Report
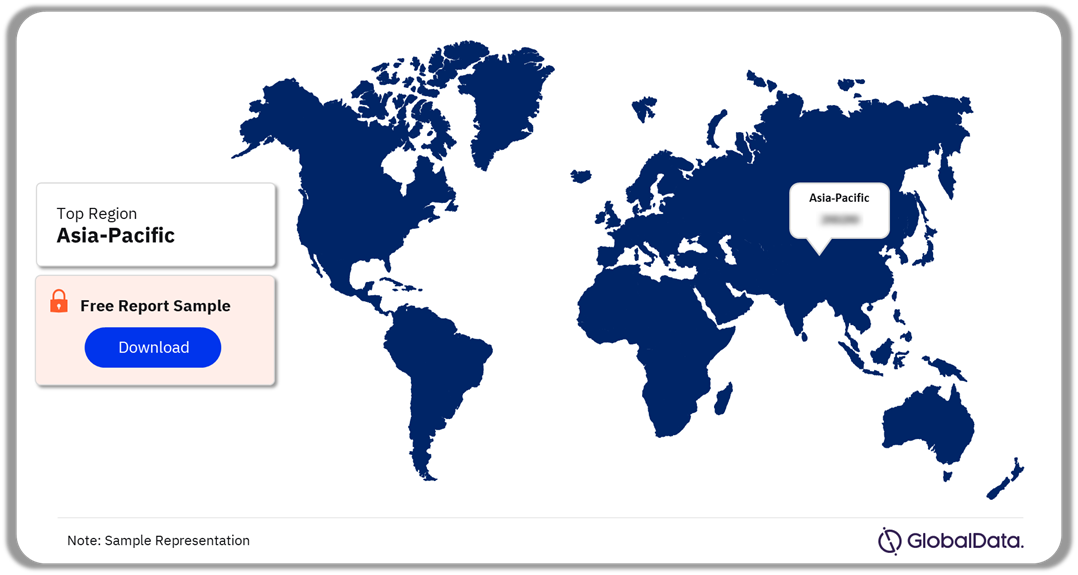
Non-Alcoholic Beverages Packaging Market Segmentation by Regions
The Asia-Pacific region held the largest volume share in 2023 in the non-alcoholic beverages packaging market
The key regions in the non-alcoholic beverages packaging market are Asia-Pacific, the Middle East & Africa, the Americas, Western Europe, and Eastern Europe. The APAC region will contribute the fastest non-alcoholic beverages market growth during the projected period. Americas followed the lead and emerged as the second most regional segment with the highest non-alcoholic beverages packaging market share.
Non-Alcoholic Beverages Packaging Market Analysis by Regions, 2023 (%)
Buy the Full Report for More Insights on Regions in the Non-Alcoholic Beverages Packaging Market Download a Free Sample Report
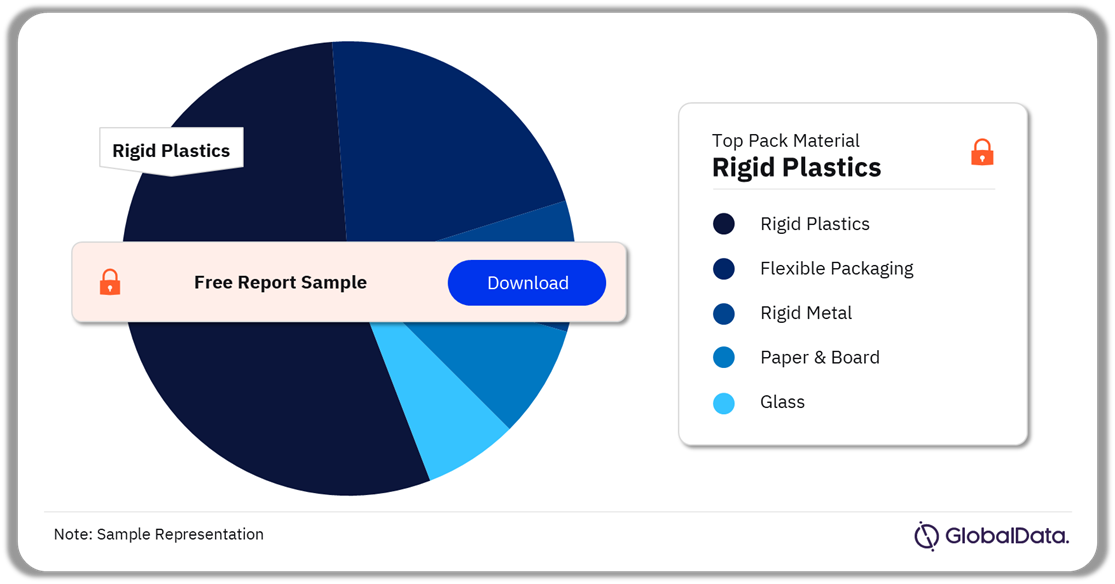
Non-Alcoholic Beverages Packaging Market Segmentation by Packaging Materials
In 2023, rigid plastics was the most consumed pack material
The key packaging materials in the non-alcoholic beverages packaging market are flexible packaging, rigid plastics, paper & board, rigid metal, and glass. Rigid plastic’s low cost and lightweight properties contribute to its widespread use in packaging. The pack material provides easy and convenient storage for both consumers and manufacturers. Rigid plastics will continue to dominate through 2028 as the most used pack material in non-alcoholic beverages.
Non-Alcoholic Beverages Packaging Market Analysis by Packaging Materials, 2023 (%)
Buy the Full Report for More Insights on Packaging Materials in the Non-Alcoholic Beverages Packaging Market
Download a Free Sample Report
Segments Covered in the Report
Non-Alcoholic Beverages Packaging Market Packaging Materials Outlook (Value, Trillion Units, 2018-2028)
- Flexible Packaging
- Rigid Plastics
- Paper & Board
- Rigid Metal
- Glass
Non-Alcoholic Beverages Packaging Market Sector Outlook (Value, Trillion Units, 2018-2028)
- Soft Drinks
- Hot Drinks
Non-Alcoholic Beverages Packaging Market Regional Outlook (Value, Trillion Units, 2018-2028)
- Asia-Pacific
- Middle East & Africa
- The Americas
- Western Europe
- Eastern Europe
Table of Contents
Table
Figures
Frequently asked questions
-
What was the non-alcoholic beverages packaging market size in 2023?
The non-alcoholic beverages packaging market size was 1.2 trillion units in 2023.
-
What is the non-alcoholic beverages packaging market growth rate during 2023-2028?
The non-alcoholic beverages packaging market will register a CAGR of more than 3% during 2023-2028.
-
Which sector accounted for the largest non-alcoholic beverages packaging market share in 2023?
In 2023, the soft drinks sector dominated the non-alcoholic beverages packaging market share.
-
Which packaging material dominated the non-alcoholic beverages packaging market in 2023?
Rigid plastics was most used in the non-alcoholic beverages packaging market in 2023.
Get in touch to find out about multi-purchase discounts
reportstore@globaldata.com
Tel +44 20 7947 2745
Sample Report
Non-Alcoholic Beverages Packaging Industry Trends, Opportunities, Growth Analysis and Forecast to 2028 was curated by the best experts in the industry and we are confident about its unique quality. However, we want you to make the most beneficial decision for your business, so we offer free sample pages to help you:
- Assess the relevance of the report
- Evaluate the quality of the report
- Justify the cost
Download your copy of the sample report and make an informed decision about whether the full report will provide you with the insights and information you need.


Related reports
View more Packaging reports
