Online Travel Market Trends and Analysis by Service Type, Region and Segment Forecast to 2030
Powered by ![]()
Access in-depth insight and stay ahead of the market

Accessing the in-depth insights from the ‘Online Travel’ report can help:
- Gain a valuable understanding of the current and future state of the market, allowing businesses to make informed decisions about market entry, product development, and investments.
- Identify competitors’ capabilities to stay ahead in the market.
- Identify segments and get an understanding of various stakeholders across different stages of the entire value chain.
- Anticipate changes in demand and adjust the business development strategies.
- Identify potential regions and countries for growth opportunities.
How is our ‘Online Travel’ report different from other reports in the market?
- The report presents in-depth market sizing and forecasts at a segment level for more than 20 countries, including historical and forecast analysis for the period 2019-30 for market assessment.
- Detailed segmentation by:
- Service Type – Transportation (Airlines, Car Rental, Others), Accommodation, Intermediation (Online Travel Agencies (OTAs), Tour Operator Websites, Other Online Travel Intermediaries), Others
- Region – North America, Europe, Asia-Pacific, South & Central America, and Middle East & Africa
- The report covers key market trends and challenges impacting the online travel market.
- The report covers dashboard analytics for M&A deals, venture financing/private equity deals, job activity, social media analytics, and patent activities.
- The competitive landscape includes competitive positioning of key companies and their strengths and limitations in the market that will help the stakeholders in the ongoing process of identifying, researching, and evaluating competitors, to gain insight to form their business strategies.
- The report covers competitive profiling and benchmarking of key companies in the market to provide a deeper understanding of industry competition.
- The report can be a valuable tool for stakeholders to improve their operations, increase customer satisfaction, and maximize profitability by analyzing the latest online travel trends, tracking market growth and demand, and evaluating the existing competition in the market.
We recommend this valuable source of information to:
- Online Travel Agents
- Tour Operators
- Airlines
- Hotel Groups
- Car Rental Companies
- Technology Companies
- Travel Ancillary Service Providers
- Venture Capital Firms
Get a Snapshot of the Online Travel Market, Download a Free Report Sample
Online Travel Market Overview
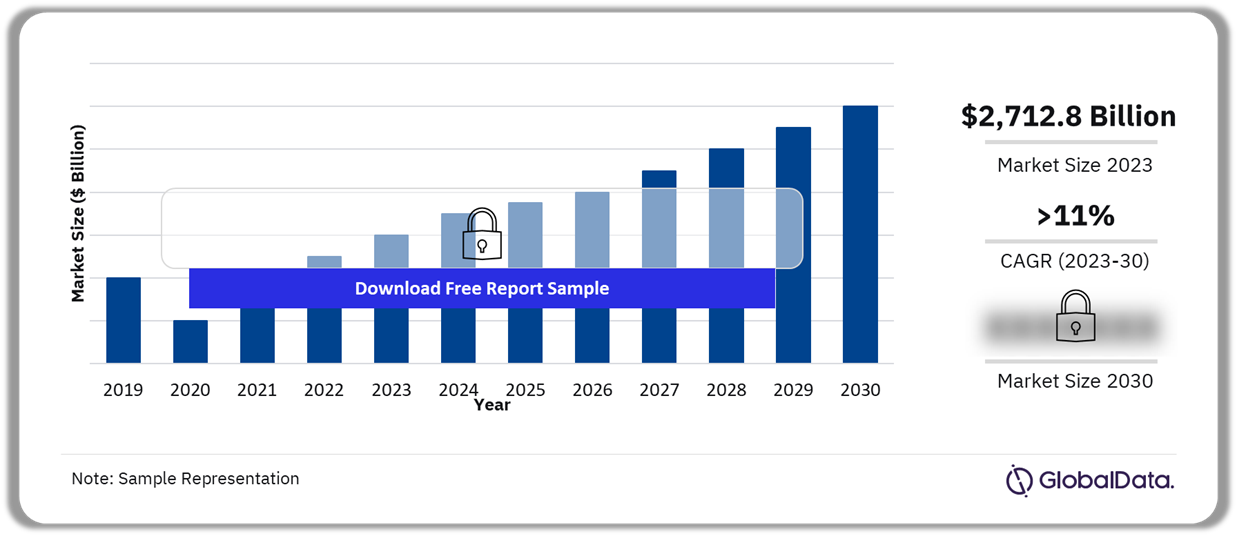
The online travel market size revenue was valued at $2,712.8 billion in 2023 and is expected to grow at a compound annual growth rate (CAGR) of more than 11% over the forecast period. The widespread use of smartphones and increasing internet penetration have revolutionized the travel industry, enabling global travelers to easily access information, compare prices, and make bookings on the go. This aligns with modern consumers’ focus on convenience and efficiency, driving the growth of the online travel market.
Travel companies are focusing on a ‘mobile-first’ app strategy to meet the needs of modern travelers. These apps, featuring easy booking processes, personalized recommendations, and 24/7 AI chatbot customer support, are increasingly favored over traditional internet methods for travel bookings. Mobile applications such as the Hilton Honors app, which provides booking, check-in, changes, digital keys, and support, significantly enhance convenience.
Online Travel Market Outlook, 2019-2030 ($Billion)
Buy the Full Report for Additional Insights on the Online Travel Market Forecast
Rising disposable incomes globally have spurred increased spending on travel experiences, with consumers willing to invest more in personalized trips. Online platforms capitalize on this trend by providing diverse options to accommodate varied preferences. The advancements in machine learning and AI further drive this trend towards personalized travel, with real-time algorithms enabling platforms to tailor recommendations based on user context and behavior. In addition to yielding higher conversion rates, this fosters further market growth.
Social media and influencer marketing also play a pivotal role in the online travel market. Tourism companies strategically partner with influencers to promote destinations on social media platforms, leveraging their extensive reach and influence. This collaborative approach facilitates direct engagement with the influencer’s followers, increasing the exposure of travel companies and destinations, and ultimately driving engagement with travel applications.
However, intense regulatory scrutiny and data privacy concerns pose a challenge to online travel companies, prompting them to implement stringent measures to safeguard user information and ensure compliance with relevant regulations. For example, travel package marketers such as MakeMyTrip Ltd. must comply with the European Economic Community Council Directive on Package Travel, Package Holidays, and Package Tours. This directive outlines obligations such as disclosing information to consumers and taking responsibility for any issues with package performance, including failures by suppliers. Also, transportation services, like cruise lines and airlines, are required to follow the regulations of multiple state and foreign authorities.
Travel companies must prioritize transparency, accountability, and compliance with data protection regulations such as the General Data Protection Regulation (GDPR) in Europe or the California Consumer Privacy Act (CCPA) in the United States. This includes obtaining consent before collecting data, implementing strong security measures, and providing users with control over their privacy preferences. Emphasizing commitment to data privacy and security in marketing messages can also build trust with consumers.
| Market Size (2023) | $2,712.8 billion |
| CAGR (2023 to 2030) | >11% |
| Forecast Period | 2023-2030 |
| Historic Data | 2019-2022 |
| Report Scope & Coverage | Revenue Forecast, Competitive Index, Company Landscape, Growth Trends |
| Service Type Segment | Transportation (Airlines, Car Rental, Others), Accommodation, Intermediation (Online Travel Agencies, Tour Operator Websites, Other Online Travel Intermediaries), Others |
| Geographies | North America, Europe, Asia Pacific, South & Central America, Middle East & Africa |
| Countries | US, Canada, Mexico, UK, Germany, France, Italy, Spain, Netherlands China, India, Japan, Thailand, Australia, South Korea, Brazil, Argentina, Colombia, UAE, South Africa, and Saudi Arabia |
| Key Companies | Airbnb Inc., American Airlines Group Inc., Booking Holdings Inc., Expedia Group Inc., Flight Centre Travel Group Ltd., MakeMyTrip Ltd., TripAdvisor Inc., TUI AG, Trip.com Group Ltd., Webjet Ltd. |
| Enquire & Decide | Discover the perfect solution for your business needs. Enquire now and let us help you make an informed decision before making a purchase. |
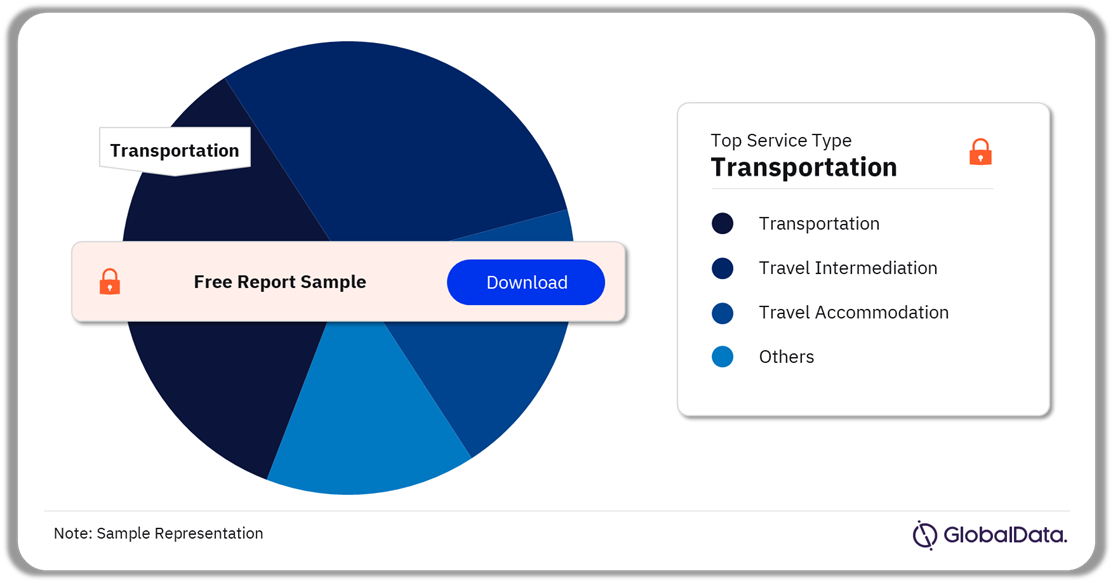
Online Travel Market Segmentation by Service Type
The growth of low-cost carriers and the rise in connecting flights, particularly for tier I and II cities globally, are fueling the increase in airline bookings. Tier I cities, marked by dense populations and high living costs, and tier II cities, recognized for their moderate living expenses and decent infrastructure, are witnessing enhanced connectivity and travel opportunities. This trend substantially boosts the overall growth of the transportation sector.
The emergence of lifestyle trends such as digital nomadism, where individuals use technology to work remotely while traveling, is fueling the demand for alternative accommodation. Alternative accommodations are lodging options other than traditional hotels, such as vacation rentals, boutique hotels, bed and breakfasts, hostels, campsites, and homestays. These accommodations provide digital nomads with unique and often more personalized experiences, which are particularly suitable for longer stays.
Online Travel Market Share by Service Type, 2023 (%)
Buy the Full Report for More Information on Online Travel Market Applications
Travelers are growing more accustomed to using travel intermediary platforms such as OTAs, which are always accessible and user-friendly. In addition to convenience, innovative loyalty programs and adaptable business models that quickly adjust to traveler preferences, attract customers away from traditional agents. Travel intermediaries present their services via packages that typically bundle two or more travel amenities, including transportation, tours, lodging, meals, and entertainment, which will fuel the segmental growth during the forecast period.
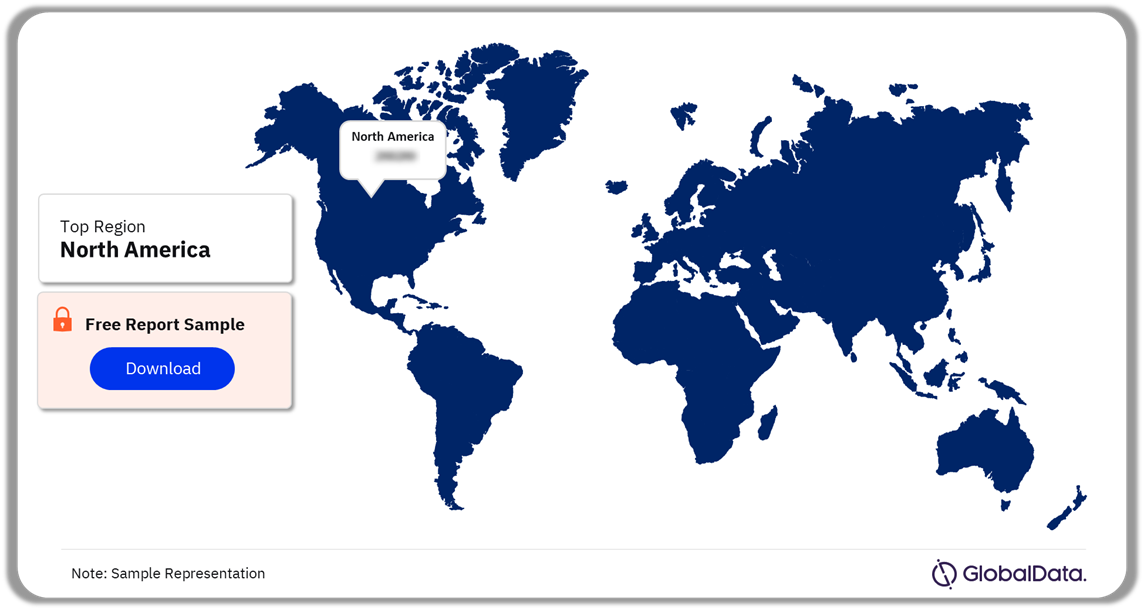
Online Travel Market Segmentation by Region
In 2023, North America led the market with the highest revenue share and is projected to maintain robust growth throughout the forecast period. In the United States, the growth of online travel services is driven by a surge in both international tourism and domestic business travel. Additionally, a thriving hospitality industry is further bolstering the popularity of online booking services. Similarly, Canada’s online travel market is flourishing due to an increasing number of international travelers.
The Asia Pacific market is anticipated to exhibit the fastest growth over the forecast period. The region presents an exciting growth opportunity for the online travel sector due to increased digitalization, a relatively young population, and rising income levels in several countries. According to the United Nations Economic and Social Commission for Asia and the Pacific (UNESCAP), Asia Pacific is home to around 60% of the world’s young population. Additionally, more than 75% of the region’s population owns a smartphone and more than 60% has access to the internet, as per GSMA’s ‘The Mobile Economy’ report of 2023.
Online Travel Market Share by Region, 2023 (%)
Buy the Full Report for Regional Insights into the Online Travel Market
Europe ranks as the second largest market driven by high smartphone penetration and access to high-speed internet connectivity. The region also benefits from its rich cultural diversity and hosts several events, including Germany’s Oktoberfest and the Carnival of Venice. Online travel services in the region prioritize providing information about these festivals, assisting travelers in planning trips focused on unique cultural experiences.
The growth of the South and Central American region market is bolstered by eco-tourism, offering outdoor adventures such as exploring the Amazon rainforests. This trend has prompted the region to provide rustic accommodations and nature-centric activities to meet the rising demand.
The development of top-tier hotels and attractions has enticed travelers to visit Middle Eastern and African countries, fueling regional growth. African nations are benefiting from favorable policy shifts and increased investment in tourism. South Africa, Kenya, and Rwanda, for instance, have become sought-after venues for exhibitions and conferences, prompting substantial investments in hotel infrastructure.
Online Travel Market – Competitive Landscape
The online travel market is fiercely competitive, with numerous established companies and smaller regional players vying for market share. Established firms are actively engaged in mergers and acquisitions to broaden their reach into new regions. They leverage advanced technology to improve online travel booking platforms and enhance user satisfaction.
For instance, in March 2024, American Express Global Business Travel (Amex GBT), a company specializing in B2B software and services for travel and expenses, revealed its definitive agreement to purchase CWT, a worldwide provider of business travel and meeting solutions. The acquisition, valued at around $570 million, will grant CWT clients access to Amex GBT’s exclusive travel and expense software and services, including Neo1, Neo, and Egencia.
Companies are leveraging online platforms for transactions, information dissemination, marketing, and direct communication with customers. They are prioritizing social media marketing, and are investing in advanced technologies like big data, artificial intelligence, and travel apps.
The growth of OTAs, booking platforms, and sharing economy services has increased competition in the travel industry, presenting both challenges and opportunities for businesses. Price comparison websites add to the complexity, forcing market participants to adopt competitive pricing strategies to retain market share. To differentiate themselves, travel companies are adopting innovative strategies which include focusing on niche markets, targeting specific customer groups, or providing additional services beyond accommodation or transportation.
Leading Companies in the Online Travel Market
- Airbnb Inc.
- American Airlines Group Inc.
- Booking Holdings Inc.
- Expedia Group Inc.
- Flight Centre Travel Group Ltd.
- MakeMyTrip Ltd.
- TripAdvisor Inc.
- TUI AG
- Trip.com Group Ltd.
- Webjet Ltd.
Buy the Full Report to Know More About Leading Online Travel Companies
Online Travel Market Segments
GlobalData Plc has segmented the online travel market report by service type and region:
Online Travel Market Service Type Outlook (Revenue, $Million, 2019-2030)
- Transportation
- Airlines
- Car Rental
- Others
- Travel Intermediation
- Online Travel Agencies
- Tour Operator Websites
- Other Online Travel Intermediaries
- Travel Accommodation
- Others
Online Travel Market Regional Outlook (Revenue, $Million, 2019-2030)
- North America
-
- US
- Canada
- Mexico
- Europe
-
- Germany
- UK
- Italy
- France
- Spain
- Netherlands
- Rest of Europe
- Asia Pacific
-
- China
- Japan
- India
- Australia
- Thailand
- South Korea
- Rest of Asia Pacific
- South & Central America
-
- Brazil
- Argentina
- Colombia
- Rest of South & Central America
- Middle East & Africa
-
- United Arab Emirates (UAE)
- South Africa
- Saudi Arabia
- Rest of the Middle East & Africa
Scope
This report provides overview and service addressable market for online travel market.
It identifies the key trends impacting growth of the online travel market over the next 12 to 24 months.
It includes global market forecasts for the online travel market and analysis of M&A deals, VF/PE deals, patents, social media, and job market trends.
It contains details of M&A deals in the online travel space and a timeline highlighting milestones in the development of online travel market.
The detailed value chain consists of three layers: Third-Party Suppliers, Direct Suppliers, and Ancillary Suppliers
Key Highlights
The online travel market size revenue was valued at $2,712.8 billion in 2023 and is expected to grow at a compound annual growth rate (CAGR) of 11.4 % over the forecast period. The surge in usage of travel applications is the primary driver for market, supported by the increasing adoption of mobile devices and enhanced network connectivity.
Reasons to Buy
This market intelligence report offers a thorough, forward-looking analysis of the global online travel market by type and key opportunities in a concise format to help executives build proactive and profitable growth strategies.
Accompanying GlobalData’s forecast products, the report examines the assumptions, drivers, deals, strategic initiatives, and trend analysis in online travel markets.
Detailed segmentation by service type – Transportation (Airlines, Car Rental, Others), Travel Accommodation, Travel Intermediation (Online Travel Agencies, Tour Operator Websites, Other Travel Intermediaries), and Others
The report includes 50+ charts providing in-depth analysis of the market size, forecast and supporting factors which are tailor-made for an executive-level audience, with enhanced presentation quality.
The report provides an easily digestible market assessment for decision-makers built around in-depth information gathered from local market players, which enables executives to quickly get up to speed with the current and emerging trends in online travel markets.
The competitive section of the report helps in identifying the flagbearers, experimenters, contenders, and specialists based on their growth and innovation performance in the online travel industry which will help stakeholders analyze competition penetration.
The broad perspective of the report coupled with comprehensive, actionable detail will help mining sector stakeholders, service providers, and other online travel players succeed in growing the online travel market globally.
Key Players
Airbnb Inc.American Airlines Group Inc.
Booking Holdings Inc.
Expedia Group Inc.
Flight Centre Travel Group Ltd.
MakeMyTrip Ltd.
TripAdvisor Inc.
TUI AG
Trip.com Group Ltd.
Webjet Ltd.
Table of Contents
Table
Figures
Frequently asked questions
-
What was the online travel market size in 2023?
The online travel market size was valued at $2,712.8 billion in 2023.
-
What is the online travel market growth rate?
The online travel market is expected to grow at a CAGR of more than 11% during the forecast period.
-
What are the key online travel market drivers?
The surge in usage of travel applications is the primary market driver, supported by the increasing adoption of mobile devices and enhanced network connectivity. Furthermore, the growing enthusiasm among individuals in frequent travel, coupled with the emergence of influencer culture, is poised to bolster market growth.
-
Which was the leading service type segment in the online travel market in 2023?
The transportation segment accounted for the largest online travel market share by service type in 2023.
-
Which was the leading regional market in the online travel market in 2023?
North America accounted for the largest share of the online travel market in 2023.
-
Which are the leading online travel companies globally?
The leading online travel companies are Airbnb Inc., American Airlines Group Inc., Booking Holdings Inc., Expedia Group Inc., Flight Centre Travel Group Ltd., MakeMyTrip Ltd., TripAdvisor Inc., TUI AG, Trip.com Group Ltd., Webjet Ltd.
-
Is there a third level of segmentation in the report?
GlobalData’s focus is on providing reliable and accurate data that is supported by robust research methodology. Our reports undergo rigorous quality checks and are based on primary and secondary research sources, ensuring that the numbers and insights provided are trustworthy. However, despite the best efforts to gather comprehensive data, there could be instances where the available data is limited, making it challenging to provide third-level segmentation. In such cases, GlobalData may choose to provide high-level insights and general trends rather than forcing segmentation that may not be backed by sufficient data. This approach ensures that the report’s overall quality and credibility are maintained.
Get in touch to find out about multi-purchase discounts
reportstore@globaldata.com
Tel +44 20 7947 2745
Every customer’s requirement is unique. With over 220,000 construction projects tracked, we can create a tailored dataset for you based on the types of projects you are looking for. Please get in touch with your specific requirements and we can send you a quote.
Sample Report
We are confident about Online Travel Market Trends and Analysis by Service Type, Region and Segment Forecast to 2030 report's unique quality. However, we want you to make the most beneficial decision for your business, so we offer free sample pages to help you:
- Assess the relevance of the report
- Evaluate the quality of the report
- Justify the cost
Download your copy of the sample report and make an informed decision about whether the full report will provide you with the insights and information you need.


Related reports
View more Online Travel Sales reports