United States Confectionery Market Assessment by Categories, Distribution, Packaging, Consumergraphics and Forecasts to 2027

Powered by

All the vital news, analysis, and commentary curated by our industry experts.

United States Confectionery Market Report Overview

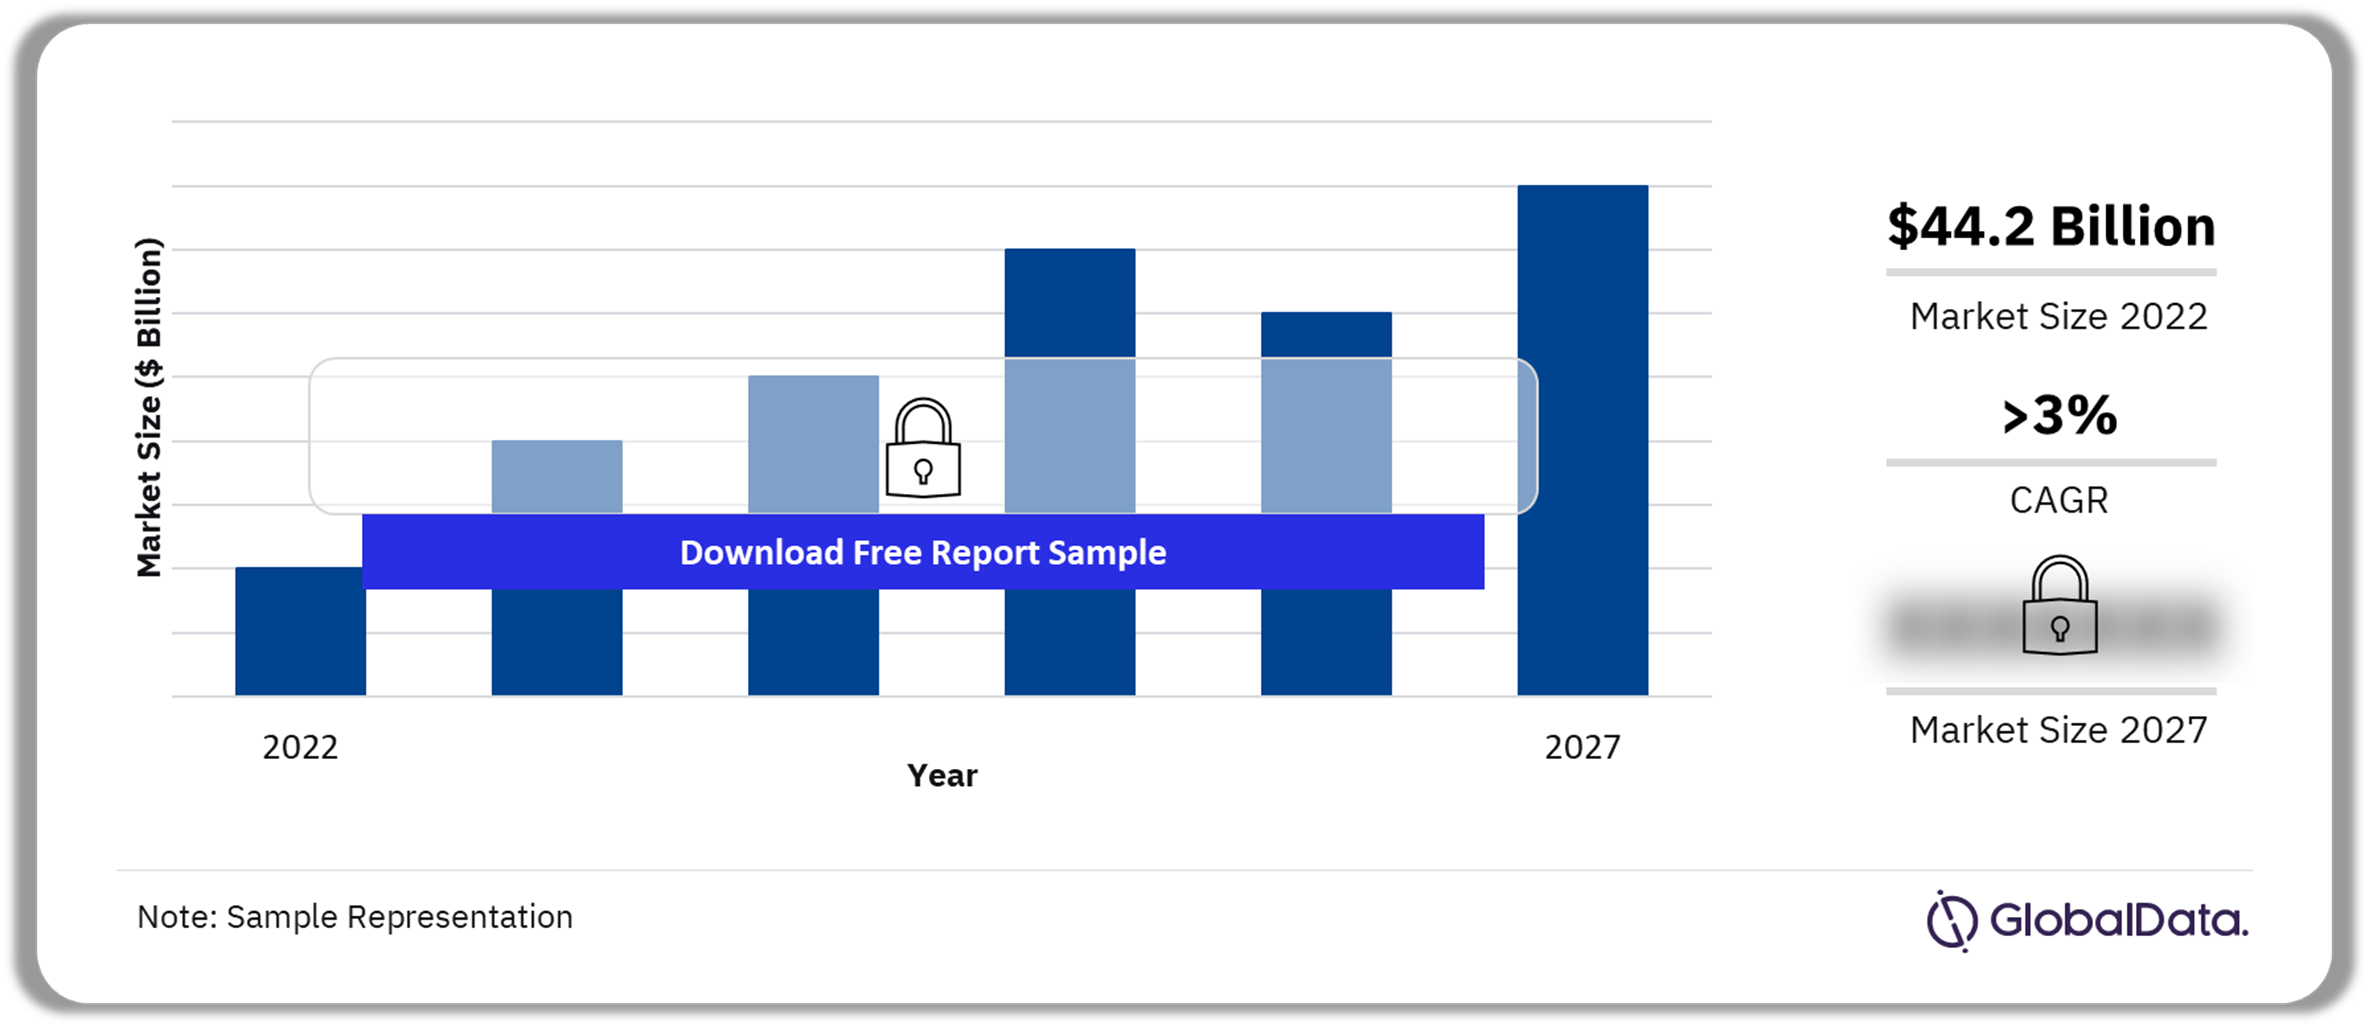
The United States (US) confectionery market was estimated to grow at $44.2 billion in 2022. The market is likely to grow at a CAGR of more than 3% during 2022-2027. The US confectionery market research report provides insights on high-growth markets to target, category-level distribution data, and companies’ market shares.

US Confectionery Market Outlook 2022-2027 ($ Billion)

US Confectionery Market Outlook 2022-2027 ($ Billion)

Buy the Full Report for the US Confectionery Market Forecasts,
Download a Free Sample Report

Market Size (2022) $44.2 billion
CAGR (2022-2027) >3%
Key Categories ·        Chocolate

·        Gum

·        Sugar Confectionery

Key Distribution Channels ·        Hypermarkets & Supermarkets

·        Convenience Stores

·        E-retailers

·        Drug Stores & Pharmacies

·        Food & Drinks Specialists

·        Cash & Carries and Warehouse Clubs

Key Cities ·        New York, NY

·        Los Angeles, CA

·        Chicago, IL

·        Dallas, TX

·        Houston, TX

·        Miami, FL

Key Packaging Materials ·        Flexible Packaging

·        Rigid Plastics

·        Paper & Board

·        Rigid Metal

Leading Companies ·        The Hershey Company

·        Mars, Incorporated

·        Ferrero

·        Chocoladefabriken Lindt & Sprüngli AG

·        Mondelēz International, Inc

·        Private Label

Enquire & Decide Discover the perfect solution for your business needs. Enquire now and let us help you make an informed decision before making a purchase.

US Confectionery Market Segmentation by Categories

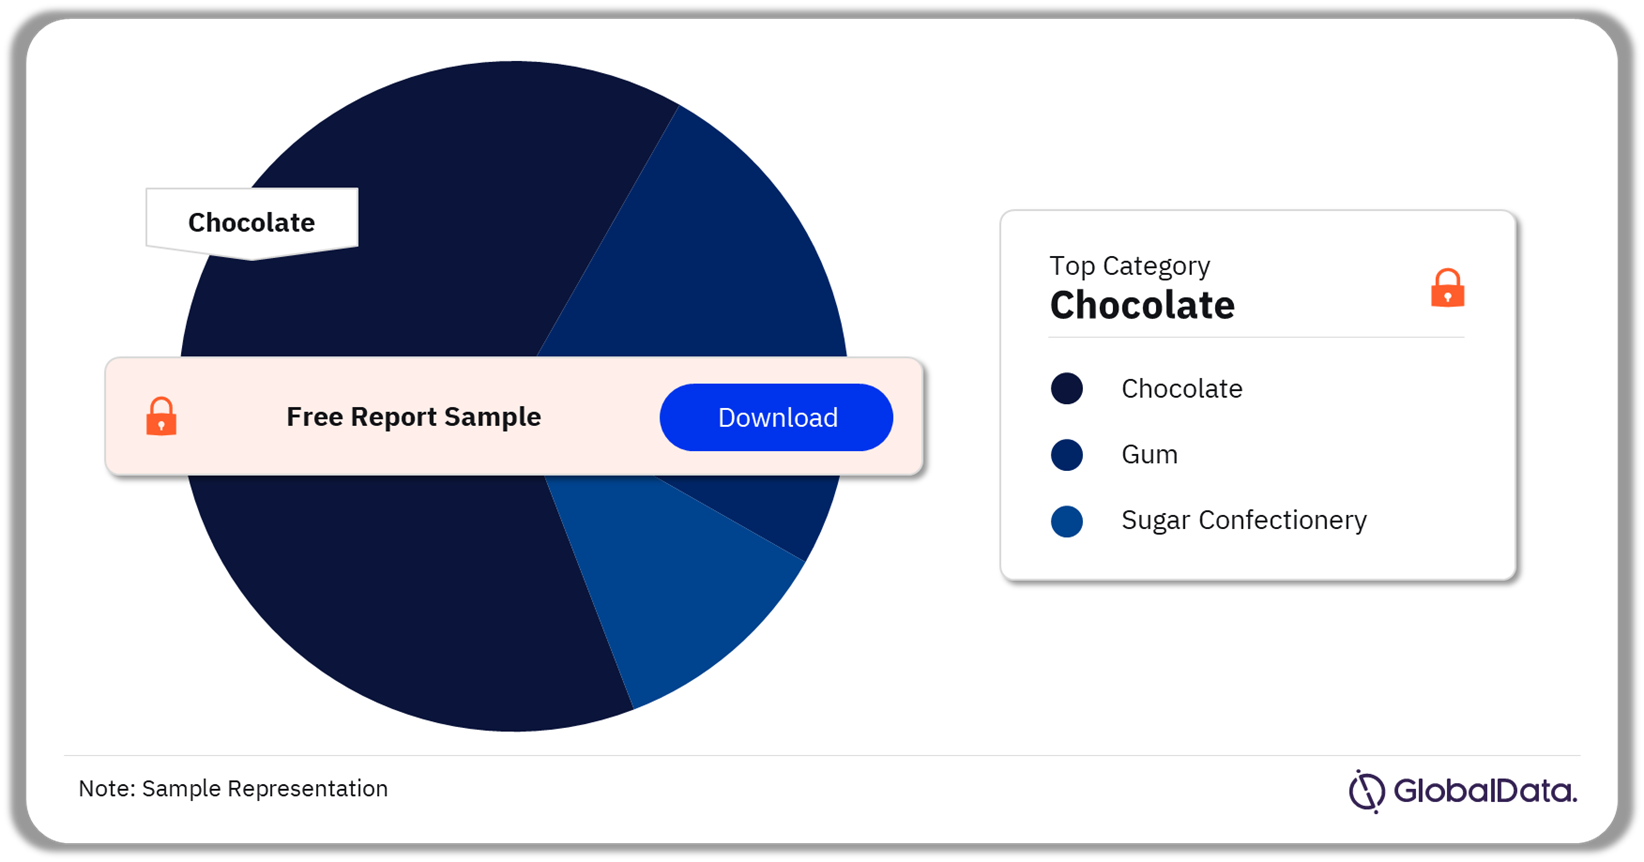
The key categories in the US confectionery market are chocolate, gum, and sugar confectionery. In 2022, chocolate was the leading category, followed by sugar confectionery and gum. However, the sugar confectionery category is forecast to register the fastest value growth at a CAGR of more than 4% during 2022–27. In the chocolates category, chocolate countlines was the leading segment, while boxed chocolate is anticipated to garner the fastest growth during the next few years.

US Confectionery Market Analysis by Categories, 2022 (%)

US Confectionery Market Analysis by Categories, 2022 (%)

Buy the Full Report for More Category-Wise Insights in the US Confectionery Market, Download a Free Sample Report

US Confectionery Market Segmentation by Distribution Channels

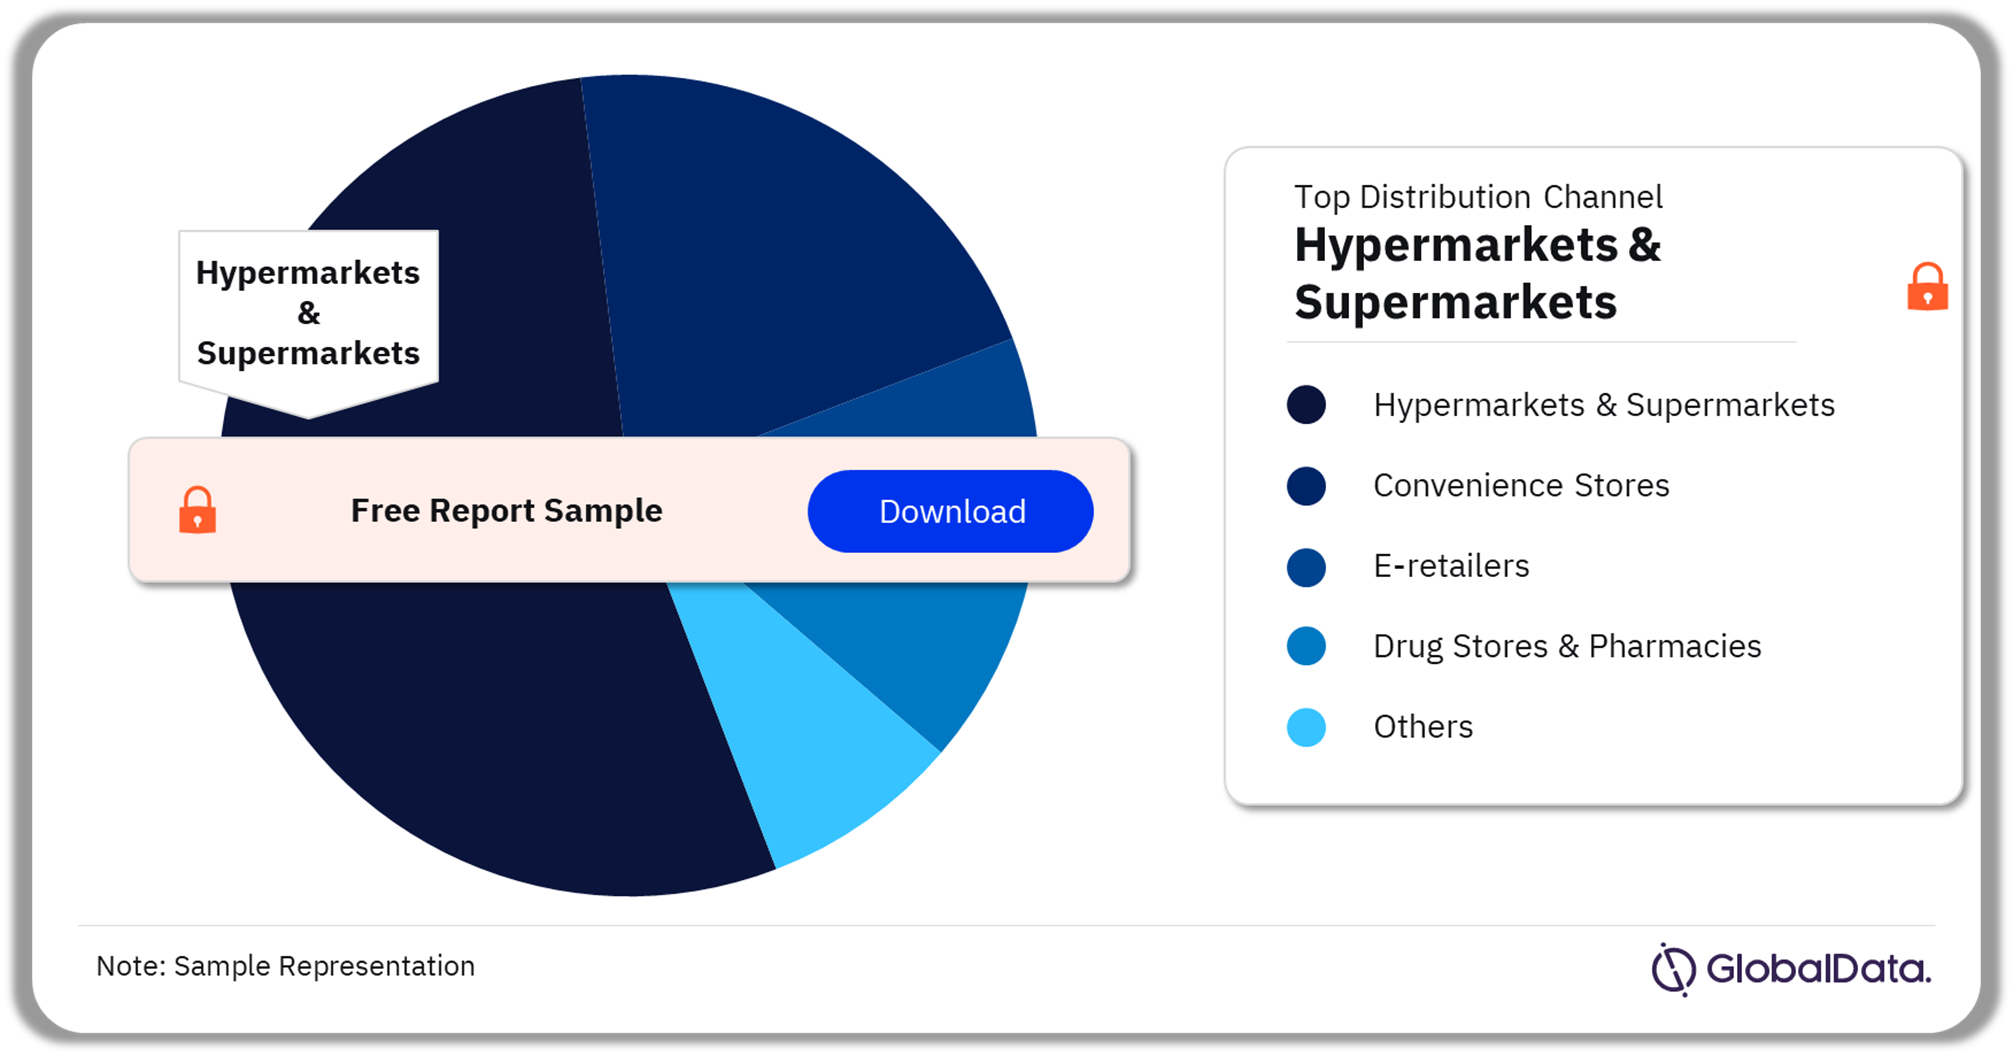
The key distribution channels in the US confectionery market are hypermarkets & supermarkets, convenience stores, e-retailers, drug stores & pharmacies, food & drinks specialists, and cash & carries and warehouse clubs. In 2022, hypermarkets & supermarkets was the leading distribution channel in the US confectionery market, followed by convenience stores, and e-retailers.

US Confectionery Market Analysis by Distribution Channel, 2022 (%)

US Confectionery Market Analysis by Distribution Channel, 2022 (%)

Buy the Full Report for More Channel-Wise Insights in the US Confectionery Market, Download a Free Sample Report

US Confectionery Market Segmentation by Cities

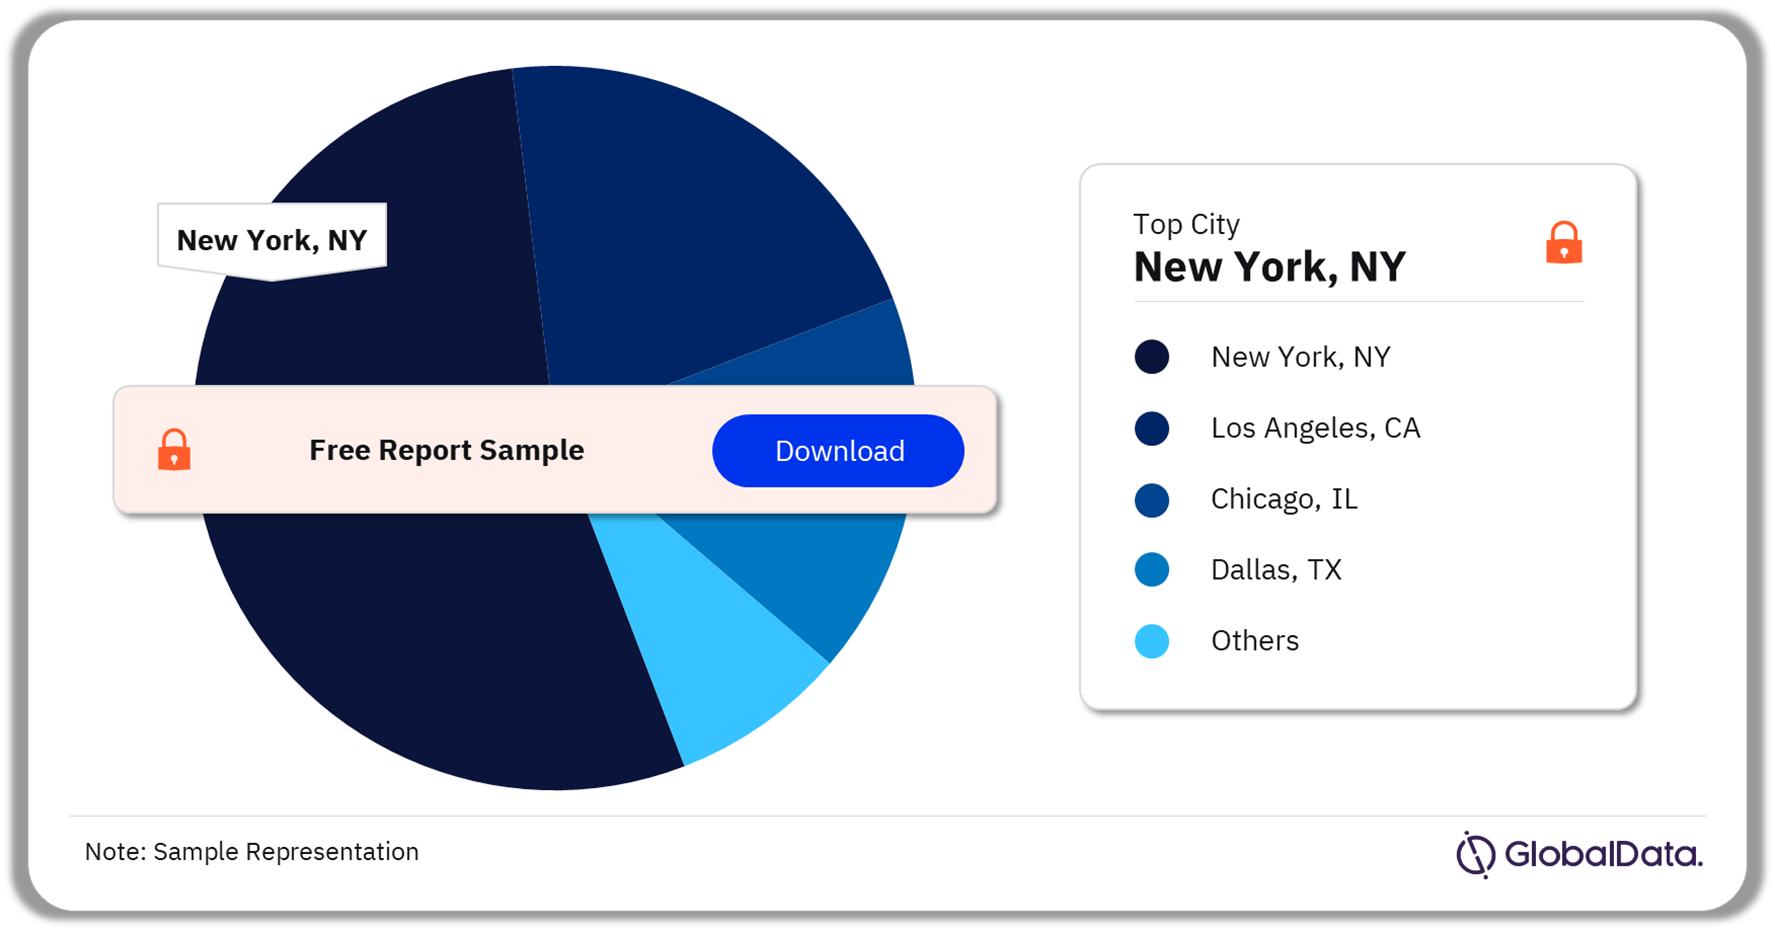
The key cities in the US confectionery market are New York, NY, Los Angeles, CA, Chicago, IL, Dallas, TX, Houston, TX, and Miami, FL. In 2022, New York emerged as the largest confectionery market in the US, followed by Los Angeles.

US Confectionery Market Analysis by Cities, 2022 (%)

US Confectionery Market Analysis by Cities, 2022 (%)

Buy the Full Report for More City-Wise Insights in the US Confectionery Market, Download a Free Sample Report

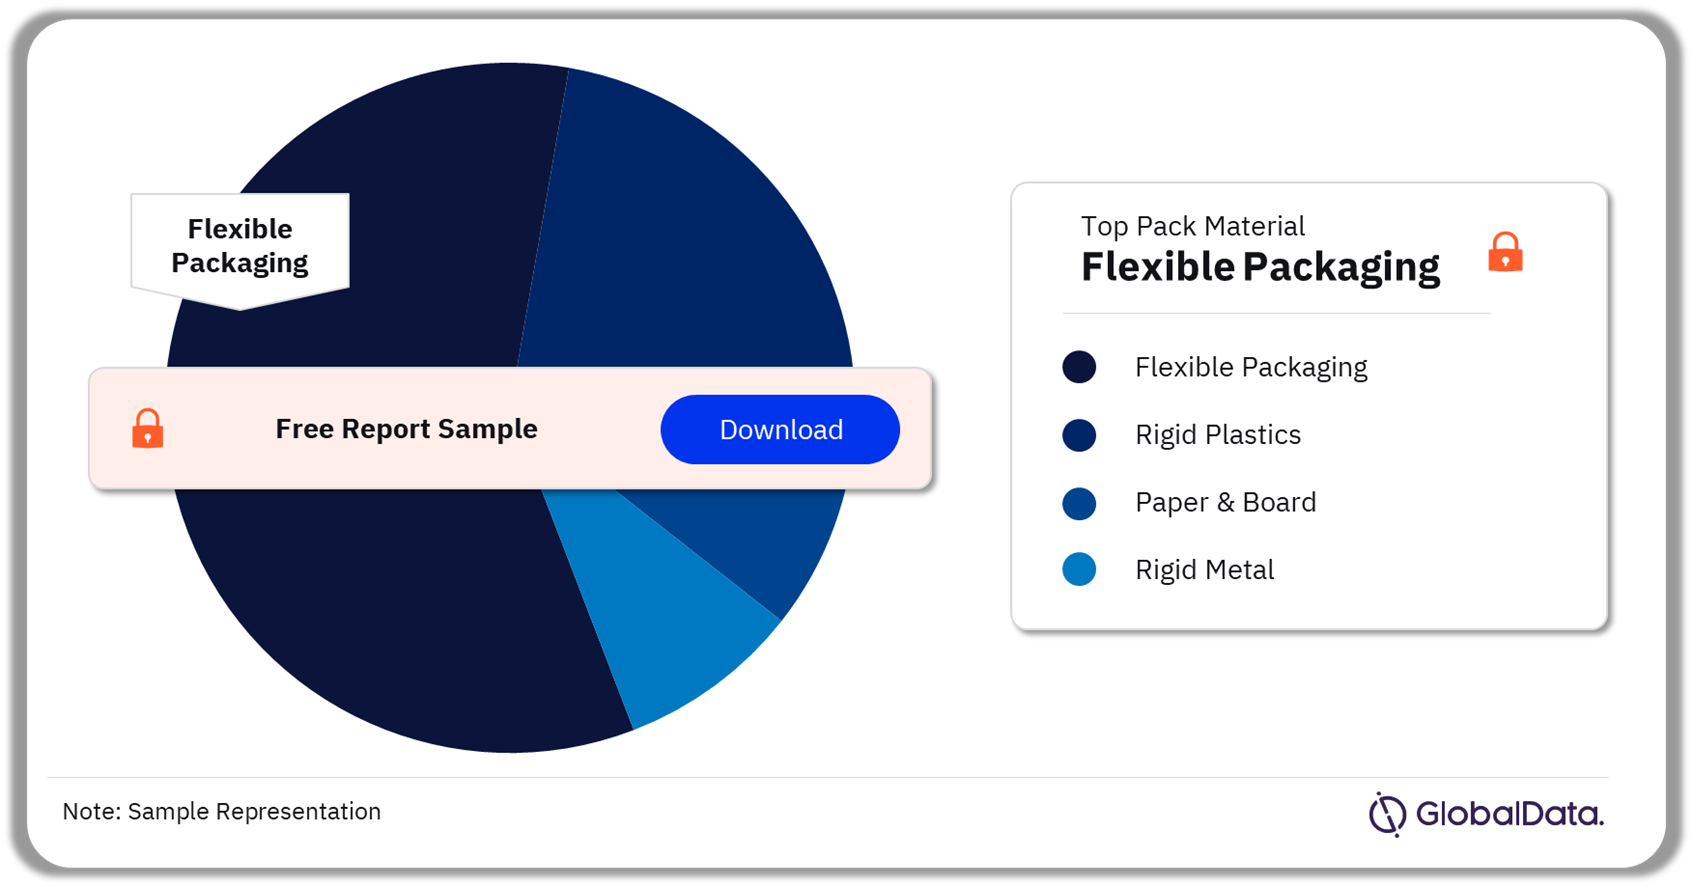
US Confectionery Market Segmentation by Pack Material

The key pack materials in the US confectionery market are flexible packaging, rigid plastics, paper & board, and rigid metal. In 2022, flexible packaging was the leading pack material in the US confectionery market, followed by rigid plastics and paper & board.

US Confectionery Market Analysis by Pack Material, 2022 (%)

US Confectionery Market Analysis by Pack Material, 2022 (%)

Buy the Full Report for More Pack Material-Wise Insights in the US Confectionery Market, Download a Free Sample Report

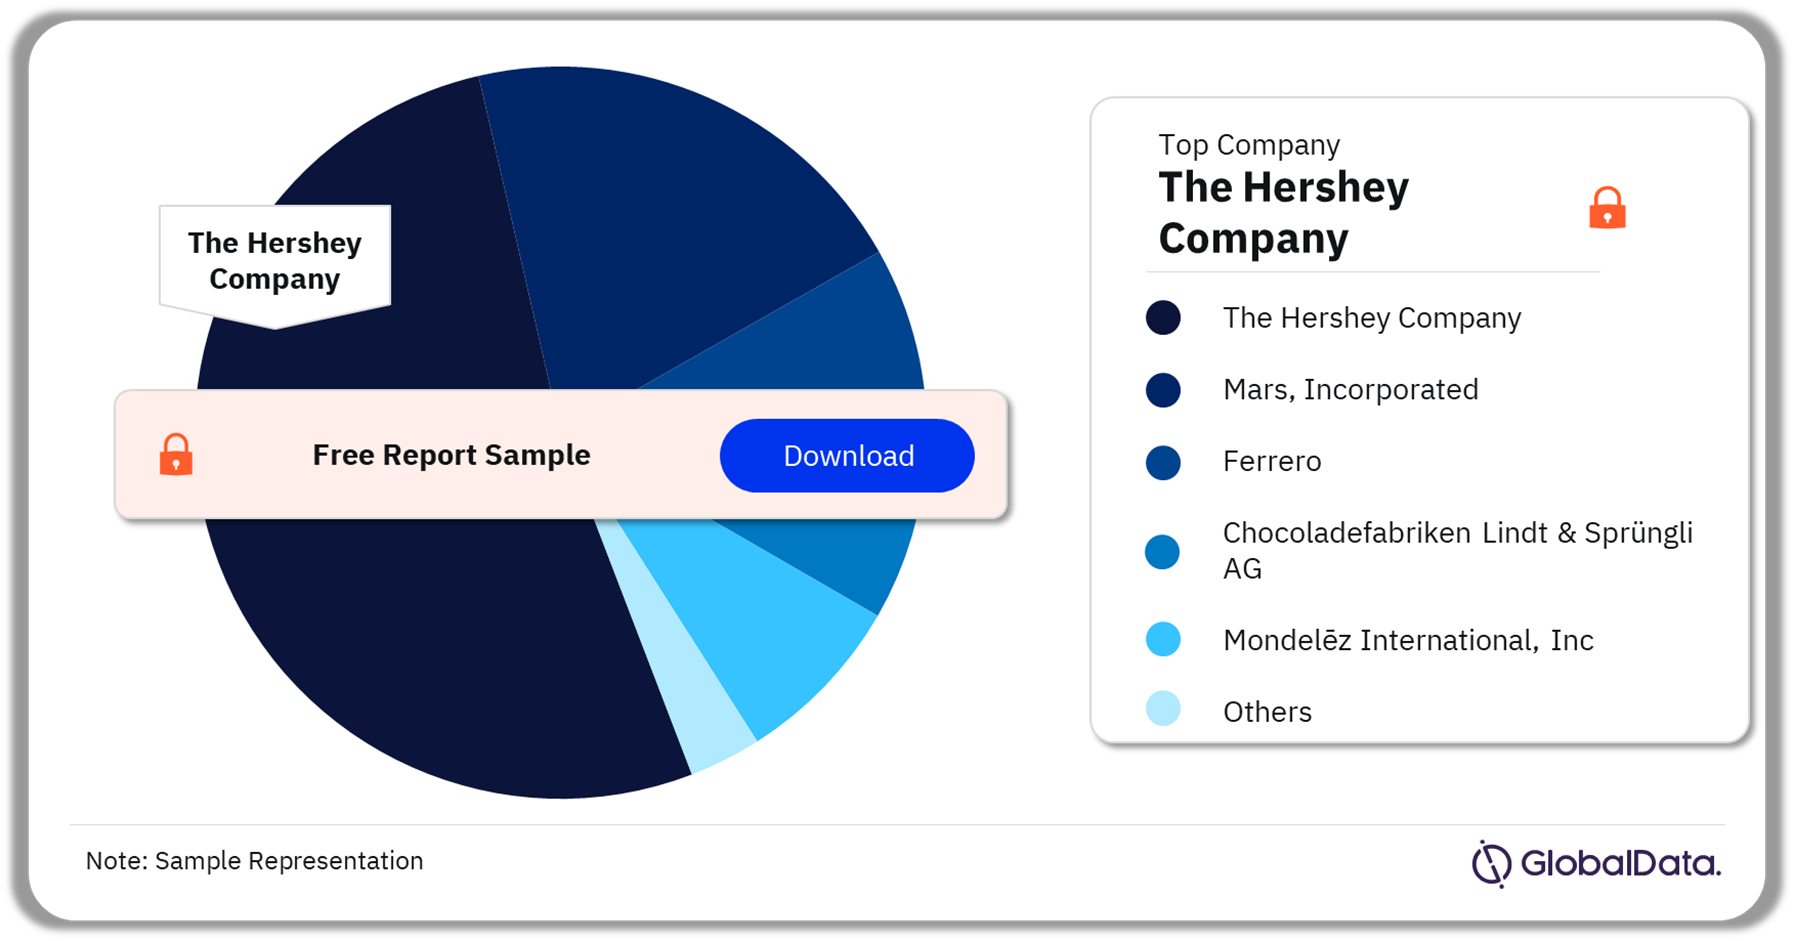
US Confectionery Market – Competitive Landscape

Some of the leading companies in the US confectionery market are The Hershey Company, Mars, Incorporated, Ferrero, Chocoladefabriken Lindt & Sprüngli AG, and Mondelēz International, Inc among others. The Hershey Company led the US confectionery market share in 2022. It offers products in the chocolate, gum, and sugar confectionery categories under the brand names Extra Dark, Reese`s, Kisses, and Twizzlers.

US Confectionery Market Analysis by Companies, 2022 (%)

US Confectionery Market Analysis by Companies, 2022 (%)

Buy the Full Report for More Company-Wise Insights in the US Confectionery Market, Download a Free Sample Report

Scope

• Per capita consumption of confectionery was higher in the US than in both the global and regional levels in 2022

• The per capita consumption of chocolate was higher than gum and sugar confectionery categories in the US, in 2022

• Hypermarkets & supermarkets is the leading distribution channel in the US confectionery sector

• Private labels are growing at a higher CAGR than brands in the US confectionery sector

• The health & wellness market is led by the sugar confectionery category in the US confectionery sector

• Chocolate recorded highest volume sales across leading cities in the US

Reasons to Buy

  • Identify high potential categories and explore further market opportunities based on detailed value and volume
  • Existing and new players can analyze key distribution channels to identify and evaluate trends and
  • Gain an understanding of the total competitive landscape based on detailed company share analysis to plan effective market
  • Our team of analysts have placed a significant emphasis on changes expected in the market that will provide a clear picture of the opportunities that can be tapped over the next five years, resulting in revenue
  • Analysis of key macroeconomic indicators such as real GDP, nominal GDP, consumer price index, household consumption expenditure, population (by age group, gender, rural-urban split, and employed people and unemployment rate. It also includes an economic summary of the country along with the labor market and demographic trends.

The Hershey Company
Mars Incorporated
Nestlé
Chocoladefabriken Lindt & Sprüngli AG
Perfetti Van Melle SpA
Ferrero

Table of Contents

Report Scope

Executive Summary

Part 1: Market Environment

Value and Volume Share of the US in the Global and North America Markets

Growth Analysis of the US Compared to Other Leading Countries in the North America Market

PCC and PCE of the US Compared to Global and North America Market

Part 2: Sector Deep Dive

The US Confectionery Sector Snapshot

Market Size Analysis

Cross-Category Comparison -Value Growth Analysis and Category Winners and Losers

Cross-Category Comparison -Volume Growth Analysis and Category Winners and Losers

Part 3: Category DeepDive

Per Capita Consumption Analysis by Category

Market Size Analysis -Category: Chocolate

Segment-Level Analysis (in Value Terms) -Chocolate

Segment-Level Analysis (in Volume Terms) -Chocolate

Market Size Analysis -Category: Gum

Segment-Level Analysis (in Value Terms) -Gum

Segment-Level Analysis (in Volume Terms) -Gum

Market Size Analysis -Category: Sugar Confectionery

Segment-Level Analysis (in Value Terms) -Sugar Confectionery

Segment-Level Analysis (in Volume Terms) -Sugar Confectionery

Part 4: Distribution Analysis

Channel Share Analysis

Part 5: Competitive Environment

Leading Companies Value Share

Brand Share Analysis of Top Five Companies

Brand Share Analysis of Top Five Companies by Category

Private Label Share Analysis by Category

Growth of Private Labels Compared to Branded Products

Degree of Consolidation/Fragmentation by Category

Part 6: Health & Wellness Analysis

Health & Wellness Analysis by Category

Health & Wellness Analysis by Product Attributes

Health & Wellness Analysis by Consumer Benefits

Cross Category Comparison -Products with H&W Vs. Non-H&W Claims

Part 7: Packaging Analysis

Pack Material Growth Analysis

Pack Type Growth Analysis

Closure Type Growth Analysis

Primary Outer Type Growth Analysis

Part 8: City Deep Dive

Market Size Analysis of Top 10 Cities

Market Size Analysis of Top 10 Cities by Category

Part 9: Consumergraphics

Demographic Analysis

Part 10: Macroeconomic Analysis

GDP Growth and Inflation

Population Growth

Labor Market Trend

Economic Summary, Labor Market Trends, and Demographic Trends

The US Risk Index (GCRI) 2022

The US Risk Analysis -Compared to Global and North America Markets

Methodology

Definitions

Appendix

Table

Leading value categories

Fastest-growing segments (value), 2022

Cross-category comparison -by value (2017–27)

Cross-category comparison -by volume (2017–27)

Per capita consumption (by category), the US compared to North America and global levels (in units), 2022

Chocolate -value analysis by segment, 2017–27

Chocolate -volume analysis by segment, 2017–27

Gum -value analysis by segment, 2017–27

Gum -volume analysis by segment, 2017–27

Sugar confectionery -value analysis by segment, 2017–27

Sugar confectionery -volume analysis by segment, 2017–27

Change in distribution share, 2017–22

Top five companies share by brand (in value terms) in the confectionery sector, 2022

Brand shares of top five companies (in value terms) by category, 2022

Category comparison -with H&W and non-H&W claims, 2017–22

Volume share analysis of 10 cities by category (%), 2022

Performance overview (score: 1–100)

Category data, by segment

Per capita consumption (in units), 2017–27

Per capita expenditure ($), 2017–27

Confectionery sales distribution in the US -by category ($ million), 2022

Brand share (in value terms) in the confectionery sector, 2022

Brand share (in value terms) in the confectionery sector, by category, 2022

Key health & wellness product attributes driving sales in the US, 2017–22

Key health & wellness consumer benefits driving sales in the US, 2017–22

Pack material (in million pack units), 2017–27

Pack materials by category (in million pack units), 2022

Pack type (in million pack units), 2017–27

Pack types by category (in million pack units), 2022

Closure type (in million pack units), 2017–27

Closure types by category (in million pack units), 2022

Primary outer type (in million pack units), 2017–27

Primary outer types by category (in million pack units), 2022

Real GDP and annual growth (%), 2018–27

Nominal GDP and annual growth (%), 2018–27

Consumer price inflation (%), 2018–27

Employed people and unemployment rate (%), 2018–27

Nominal household final consumption expenditure and annual growth (%), 2018–27

Population and annual growth (%), 2018–27

Population by age group (%)

Population by gender (%)

Population by rural-urban split (%)

Confectionery in the US : value/volume changes at segment level

Figures

Value and volume share of the US in the global and North America confectionery sector, 2022–27

The US compared to the other top countries in terms of market share, growth, and competitive landscape

PCC comparison -the US, North America , and global, 2017–27

PCE comparison -the US, North America, and global, 2017–27

Market size and growth analysis by value and volume, confectionery sector, 2017–27

Cross-category comparison -value growth analysis and category winners and losers

Cross-category comparison -volume growth analysis and category winners and losers

Market size and growth analysis by value and volume, chocolate category, 2017–27

Market size and growth analysis by value and volume, gum category, 2017–27

Market size and growth analysis by value and volume, sugar confectionery category, 2017–27

Share of key distribution channels (in value terms) -confectionery, 2022

Key distribution channel share by category (in value terms), 2022

Leading companies (in value terms) in the confectionery sector, 2022

Private label penetration by category (in value terms), 2022

Growth analysis, private label and brands, 2017–22

Category-wise consolidation/fragmentation (in value terms) -confectionery, 2022

Prominence of health & wellness claims by category, $ million, 2017–22

Contribution of health & wellness by product attributes, $ million, 2017–22

Contribution of health & wellness by consumer benefits, $ million, 2017–22

Key pack materials in the North American confectionery sector, percentage share of pack units, 2022

Annual growth rate by key pack material, 2017–27

Use of pack material by category (in pack units), 2022

Key pack types in the North American confectionery sector, percentage share of pack units, 2022

Annual growth rate by key pack type, 2017–27

Use of pack type by category (in pack units), 2022

Key closure types in the North American confectionery sector, percentage share of pack units, 2022

Annual growth rate by key closure type, 2017–27

Use of closure type by category (in pack units), 2022

Key primary outer types in the North American confectionery sector, percentage share of pack units, 2022

Annual growth rate by key primary outer type, 2017–27

Use of primary outer type by category (in pack units), 2022

Volume growth analysis of top eight cities (million kg), 2017–22

Demographic analysis

Real GDP ($ Billion) and annual growth (%)

Nominal GDP ($ Billion) and annual growth (%)

Consumer price inflation (%)

Nominal household final consumption expenditure growth (%) in $ terms

Population (millions) and annual growth (%)

Population by age group (%)

Population by gender (%)

Population by rural-urban split (%)

Employed people (millions) and unemployment rate (%)

Economic summary, labor market trends, and demographic trends

Five lowest-risk nations in GCRI Q4 2022

Five highest-risk nations in GCRI Q4 2022

The US’s performance in country risk analysis in comparison to North America and the world

List of 108 countries analyzed to identify the high-potential countries in different regions

Frequently asked questions

United States Confectionery Market Assessment by Categories, Distribution, Packaging, Consumergraphics and Forecasts to 2027 standard reports
Currency USD
$875

Can be used by individual purchaser only

$1,750

Can be shared globally by unlimited users within the purchasing corporation e.g. all employees of a single company


Undecided about purchasing this report?

Enquire Before Buying Request a Free Sample

Get in touch to find out about multi-purchase discounts

reportstore@globaldata.com
Tel +44 20 7947 2745

Every customer’s requirement is unique. With over 220,000 construction projects tracked, we can create a tailored dataset for you based on the types of projects you are looking for. Please get in touch with your specific requirements and we can send you a quote.

Sample Report

United States Confectionery Market Assessment by Categories, Distribution, Packaging, Consumergraphics and Forecasts to 2027 was curated by the best experts in the industry and we are confident about its unique quality. However, we want you to make the most beneficial decision for your business, so we offer free sample pages to help you:

  • Assess the relevance of the report
  • Evaluate the quality of the report
  • Justify the cost

Download your copy of the sample report and make an informed decision about whether the full report will provide you with the insights and information you need.

Below is a sample report to understand what you are buying

See what our customers are saying

“The GlobalData platform is our go-to tool for intelligence services. GlobalData provides an easy way to access comprehensive intelligence data around multiple sectors, which essentially makes it a one-for-all intelligence platform, for tendering and approaching customers.

GlobalData is very customer orientated, with a high degree of personalised services, which benefits everyday use. The highly detailed project intelligence and forecast reports can be utilised across multiple departments and workflow scopes, from operational to strategic level, and often support strategic decisions. GlobalData Analytics and visualisation solutions has contributed positively when preparing management presentations and strategic papers.”

Business Intelligence & Marketing Manager, SAL Heavy Lift

“COVID-19 has caused significant interference to our business and the COVID-19 intelligence from GlobalData has helped us reach better decisions around strategy. These two highlights have helped enormously to understand the projections into the future concerning our business units, we also utilise the project database to source new projects for Liebherr-Werk to use as an additional source to pitch for new business.”

Market Analyst & Management, Liebherr-Werk

Your daily news has saved me a lot of time and keeps me up-to-date with what is happening in the market, I like that you almost always have a link to the source origin. We also use your market data in our Strategic Business Process to support our business decisions. By having everything in one place on the Intelligence Center it has saved me a lot of time versus looking on different sources, the alert function also helps with this.

Head of Key Accounts, Saab AB

Having used several other market research companies, I find that GlobalData manages to provide that ‘difficult-to-get’ market data that others can’t, as well as very diverse and complete consumer surveys.

Marketing Intelligence Manager, Portugal Foods

Our experience with GlobalData has been very good, from the platform itself to the people. I find that the analysts and the account team have a high level of customer focus and responsiveness and therefore I can always rely on. The platform is more holistic than other providers. It is convenient and almost like a one stop shop. The pricing suite is highly competitive and value for our organisation.

I like reports that inform new segments such as the analysis on generation Z, millennials, the impact of COVID 19 to our banking customers and their new channel habits. Secondly the specialist insight on affluent sector significantly increases our understanding about this group of customers. The combination of those give us depth and breadth of the evolving market.

I’m in the business of answering and helping people make decisions so with the intelligence center I can do that, effectively and efficiently. I can share quickly key insights that answer and satisfy our country stakeholders by giving them many quality studies and primary research about competitive landscape beyond the outlook of our bank. It helps me be seen as an advisory partner and that makes a big difference. A big benefit of our subscription is that no one holds the whole data and because it allows so many people, so many different parts of our organisation have access, it enables all teams to have the same level of knowledge and decision support.

Head of Customer Insight and Research, Standard Chartered

“I know that I can always rely on Globaldata’s work when I’m searching for the right consumer and market insights. I use Globaldata insights to understand the changing market & consumer landscape and help create better taste & wellbeing solutions for our customers in food, beverage and healthcare industries.

Globaldata has the right data and the reports are of very high quality compared to your competitors. Globaldata not only has overall market sizes & consumer insights on food & beverages but also provides insights at the ingredient & flavour level. That is key for B2B companies like Givaudan. This way we understand our customers’ business and also gain insight to our unique industry”

Head of Consumer Sensory Insights, Givaudan

GlobalData provides a great range of information and reports on various sectors that is highly relevant, timely, easy to access and utilise.  The reports and data dashboards help engagement with clients; they provide valuable industry and market insights that can enrich client conversations and can help in the shaping of value propositions. Moreover, using GlobalData products has helped increase my knowledge of the finance sector, the players within it, and the general threats and opportunities.

I find the consumer surveys that are carried out to be extremely beneficial and not something I have seen anywhere else. They provided an insightful view of why and which consumers take (or don’t) particular financial products. This can help shape conversations with clients to ensure they make the right strategic decisions for their business.

One of the challenges I have found is that data in the payments space is often piecemeal. With GD all of the data I need is in one place, but it also comes with additional market reports that provide useful extra context and information. Having the ability to set-up alerts on relevant movements in the industry, be it competitors or customers, and have them emailed directly to me, ensures I get early sight of industry activity and don’t have to search for news.

Senior Account Manager, TSYS
Go even deeper with GlobalData Intelligence Center

Every Company Report we produce is powered by the GlobalData Intelligence Center.

Subscribing to our intelligence platform means you can monitor developments at United States Confectionery Market Assessment by Categories, Distribution, Packaging, Consumergraphics and Forecasts to 2027 in real time.

  • Access a live United States Confectionery Market Assessment by Categories, Distribution, Packaging, Consumergraphics and Forecasts to 2027 dashboard for 12 months, with up-to-the-minute insights.
  • Fuel your decision making with real-time deal coverage and media activity.
  • Turn insights on financials, deals, products and pipelines into powerful agents of commercial advantage.